2 High-level revenues, costs and staff data
This chapter provides a preliminary overview of high-level revenues, costs and staff data provided in ANSPs ACE 2022 data submissions. Total ANS revenues in 2022 amounted to €9 024M. Most en-route revenues come from the collection of en-route charges (95.9%, see left pie chart). The proportion of terminal revenues from charges is lower (68.3%, see right pie chart), as additional income may directly come from airport operators (21.3%) through, for example, a contractual arrangement between the ANSP and the airport operator).
| En-route | % | Gate-togate revenues (€ M) | % | Terminal |
|---|---|---|---|---|
| 6 928 | 95.9% | Income from charges | 68.3% | 1 229 |
| n.a. | n.a. | Income from airport operators | 21.3% | 383 |
| 1.0 | 0.01% | Income from the military | 0.04% | 0.7 |
| 63 | 0.9% | Income in respect of exempted flights | 2.9% | 51 |
| 62 | 0.9% | Income from domestic goverment | 4.1% | 75 |
| 122 | 1.7% | Financial income | 2.1% | 38 |
| 49 | 0.7% | Other income (incl. exceptional revenue item) | 1.2% | 22 |
| 7 224 | 100% | 100% | 1 800 |
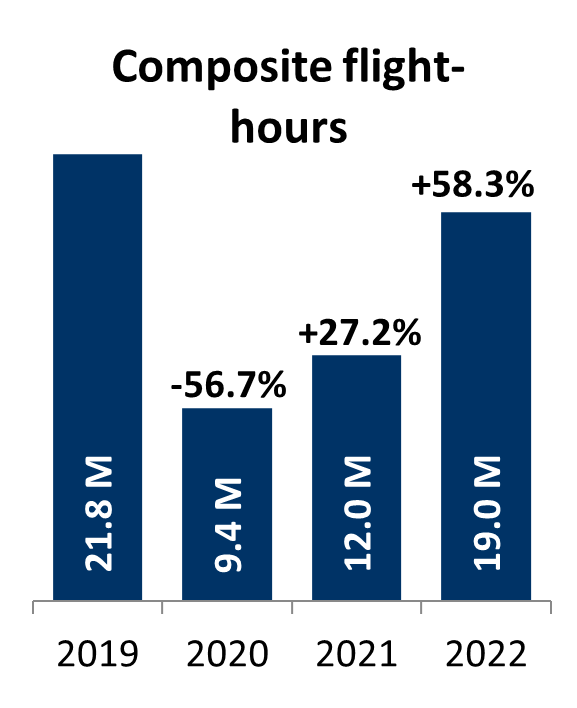
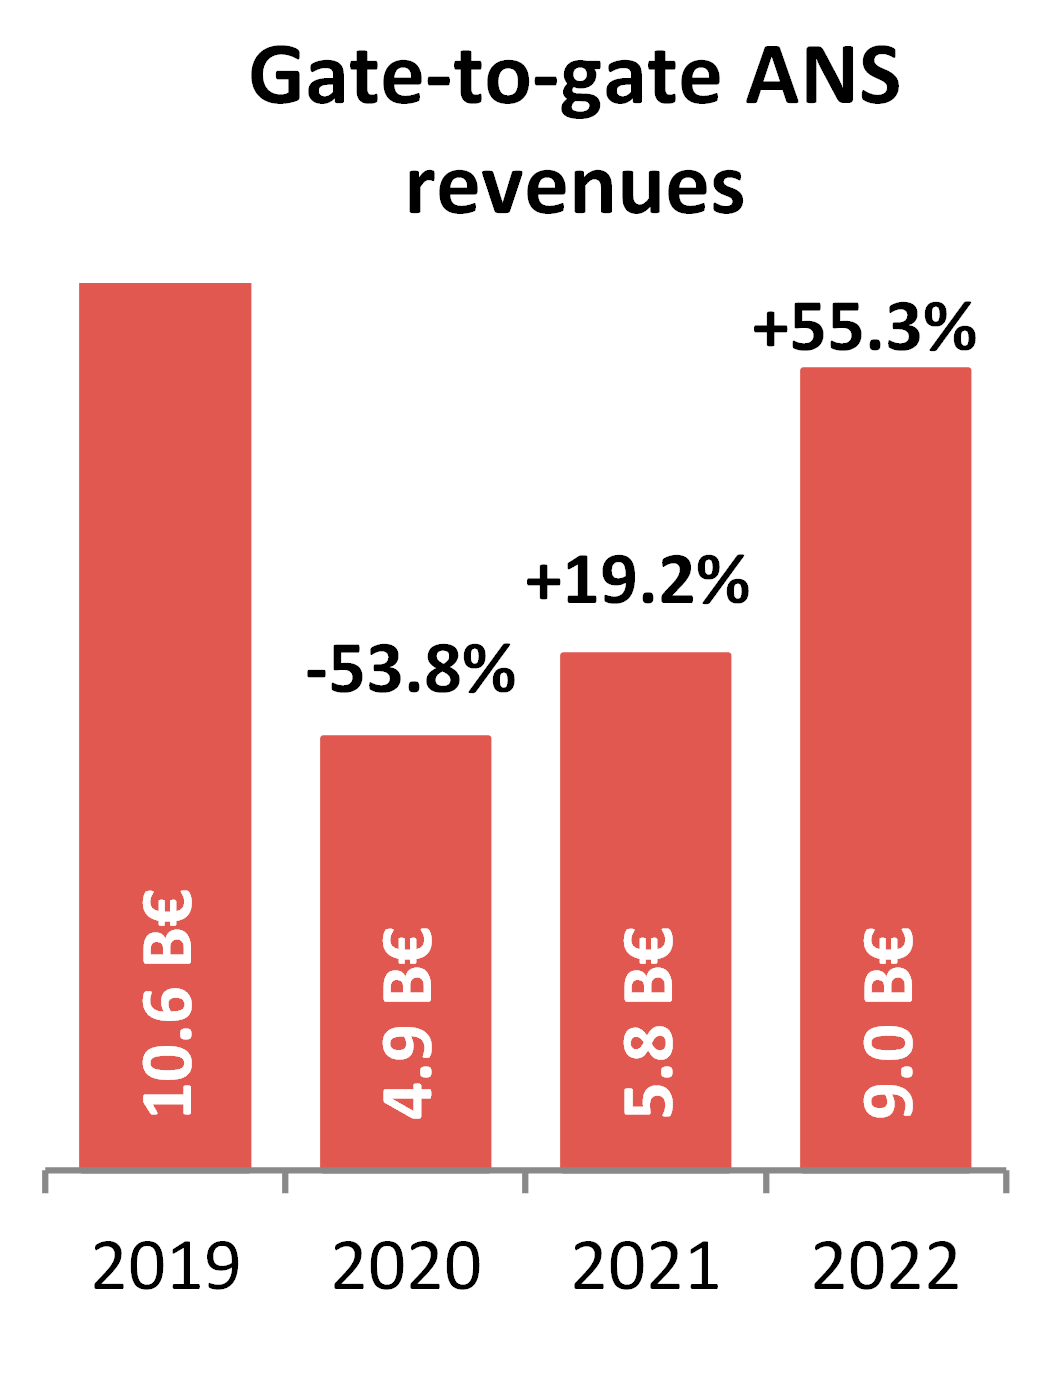
Across the Pan-European system, traffic in 2022 (measured in composite flight-hours) was +58.3% higher than in 2021 but remained -13.3% lower than in 2019. In the meantime, total gate-to-gate revenues increased slightly less than traffic (+55.3%) and remained -14.9% lower than in 2019.
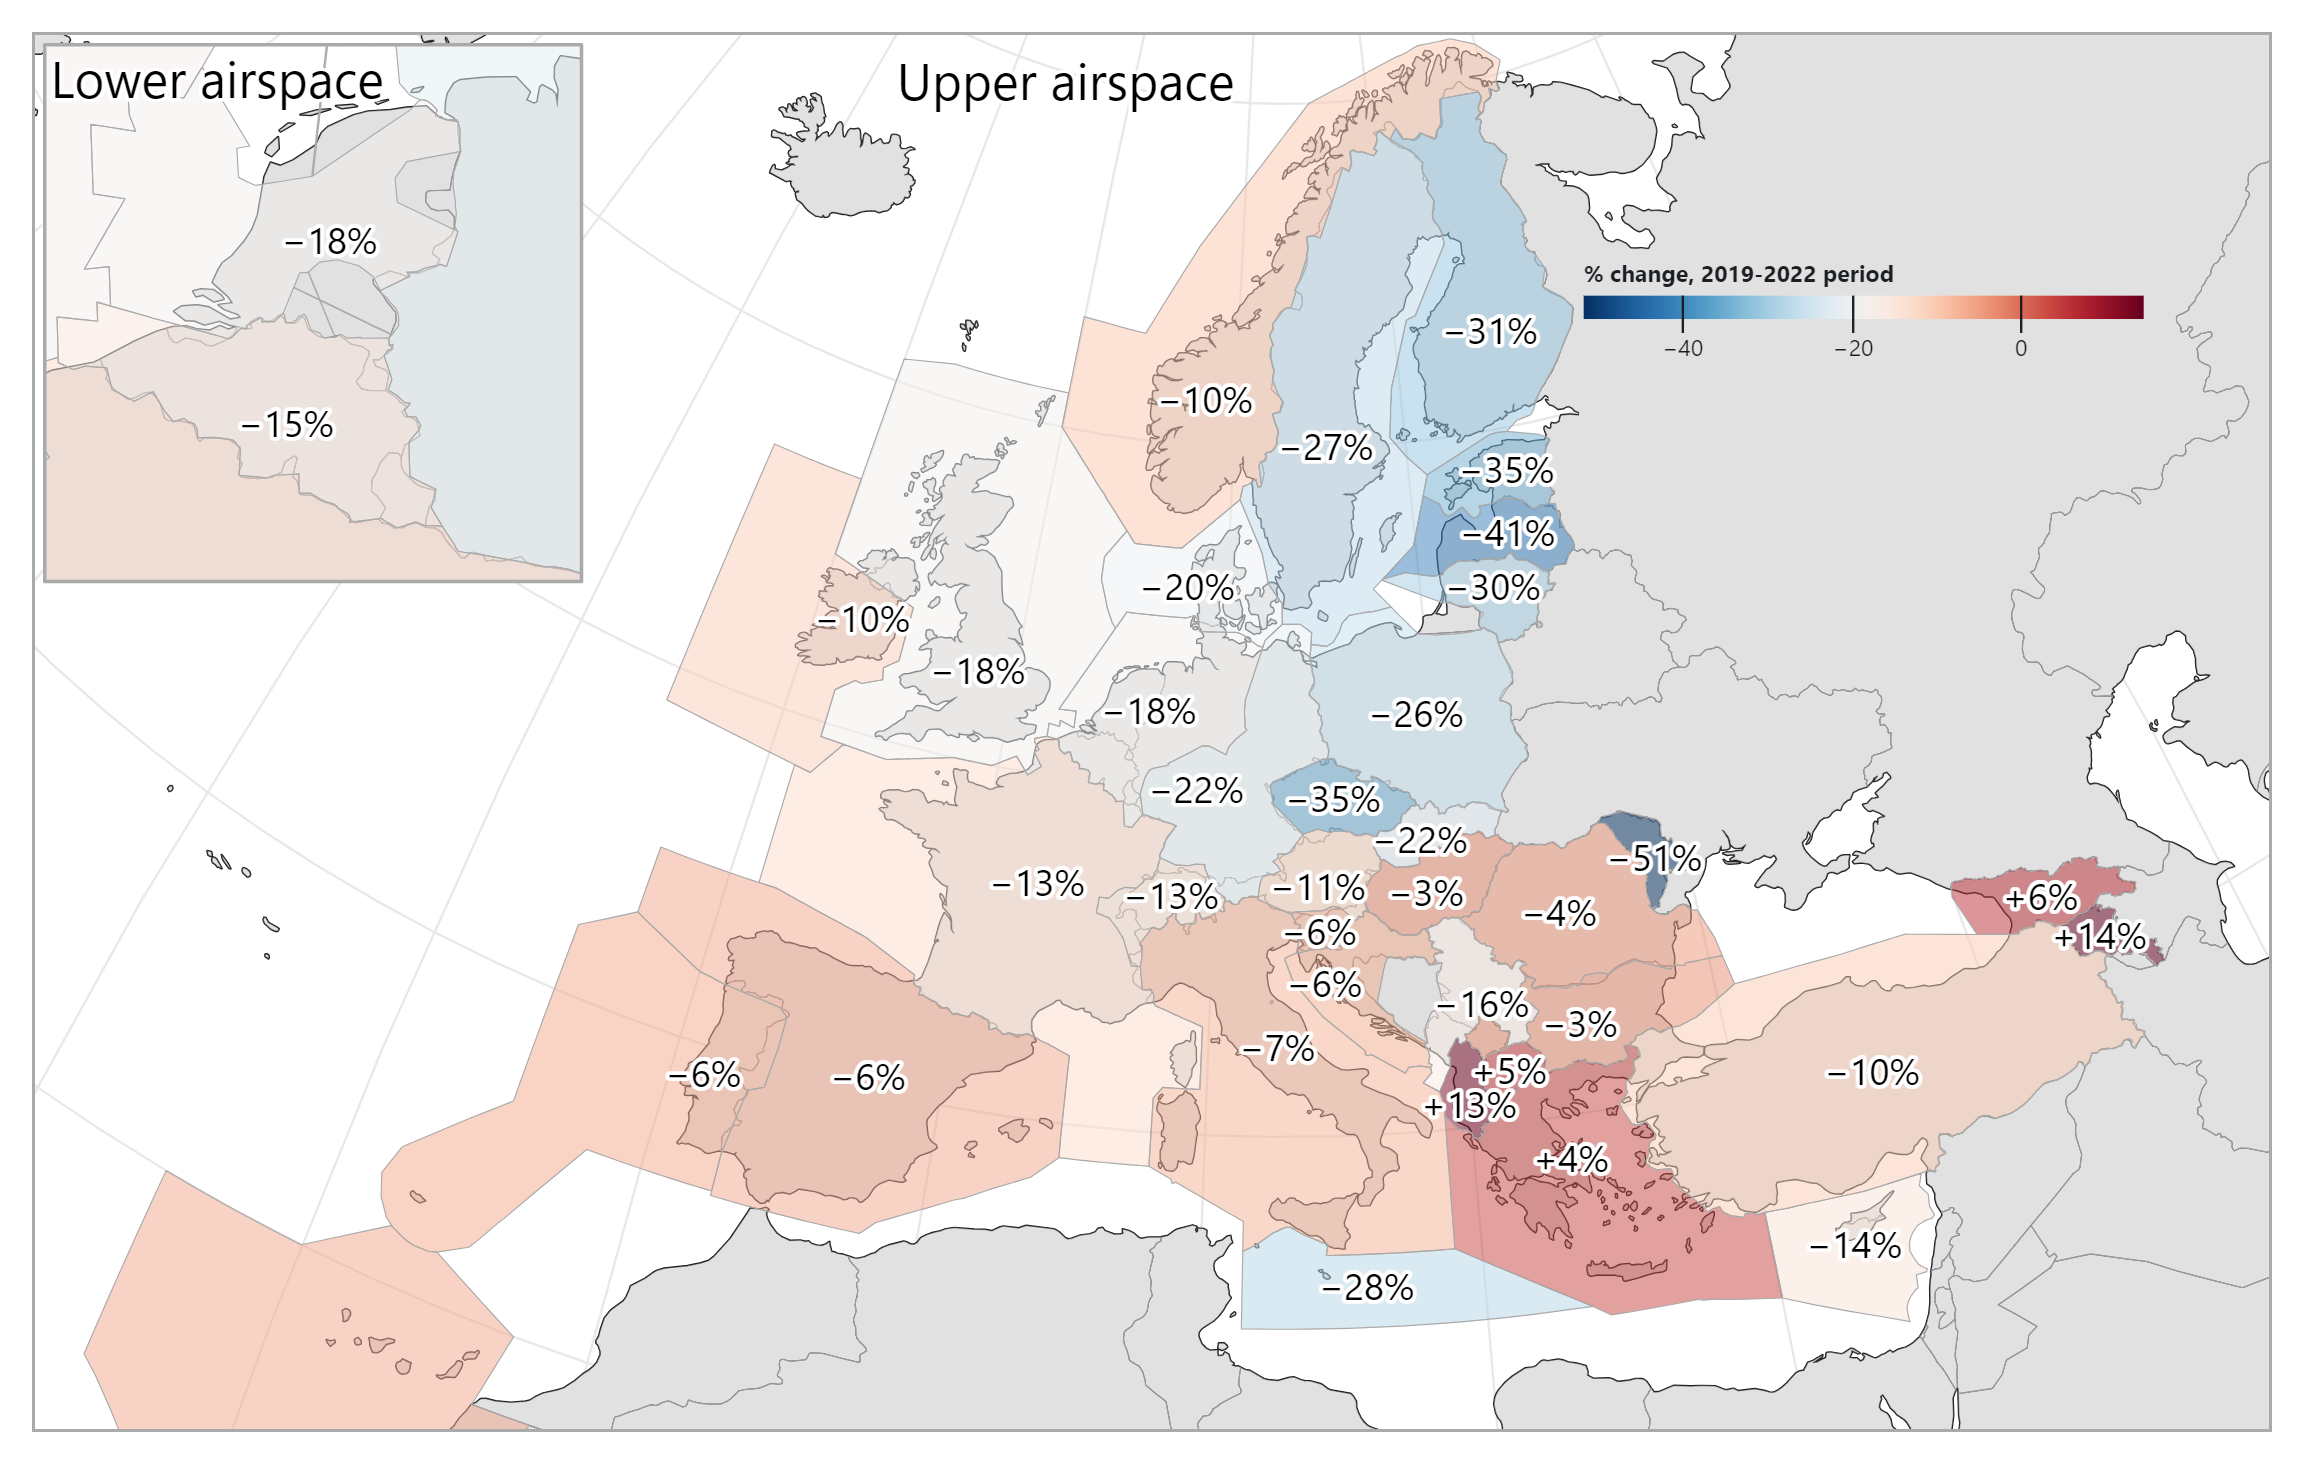
At ANSP level, a wide range of recovery rates is observed (from -51% to +14%, see Figure 2.2). The war in Ukraine also resulted in airspace closures and reciprocal sanctions on air carriers which impacted traffic flows in Europe. This inevitably impacts the levels and trends of ACE indicators for the ANSPs being most affected by the changes in traffic patterns.
The ACE benchmarking analysis focuses on the specific costs of providing gate-to-gate ATM/CNS services which amounted to €8 921M in 2022. Operating costs (including staff costs, non-staff operating costs and exceptional cost items) accounted for some 84% of total ATM/CNS provision costs, while depreciation costs and the cost of capital represented around 16%.
| En-route | Terminal | Gate-to-gate | ||||
|---|---|---|---|---|---|---|
| € M | % | € M | % | € M | % | |
| Staff costs | 4 550 | 65.2% | 1 275 | 65.4% | 5 825 | 65.3% |
| ATCOs in OPS employment costs | 2 229 | n.a. | 631 | n.a. | 2 859 | n.a. |
| Other staff employment costs | 2 321 | n.a. | 644 | n.a. | 2 965 | n.a. |
| Non-staff operating costs | 1 155 | 16.6% | 332 | 17.0% | 1 487 | 16.7% |
| Depreciation costs | 702 | 10.1% | 172 | 8.9% | 875 | 9.8% |
| Cost of capital | 453 | 6.5% | 129 | 6.6% | 582 | 6.5% |
| Exceptional items | 113 | 1.6% | 40 | 2.0% | 152 | 1.7% |
| Total ATM/CNS provision costs | 6 973 | 100.0% | 1 948 | 100.0% | 8 921 | 100.0% |
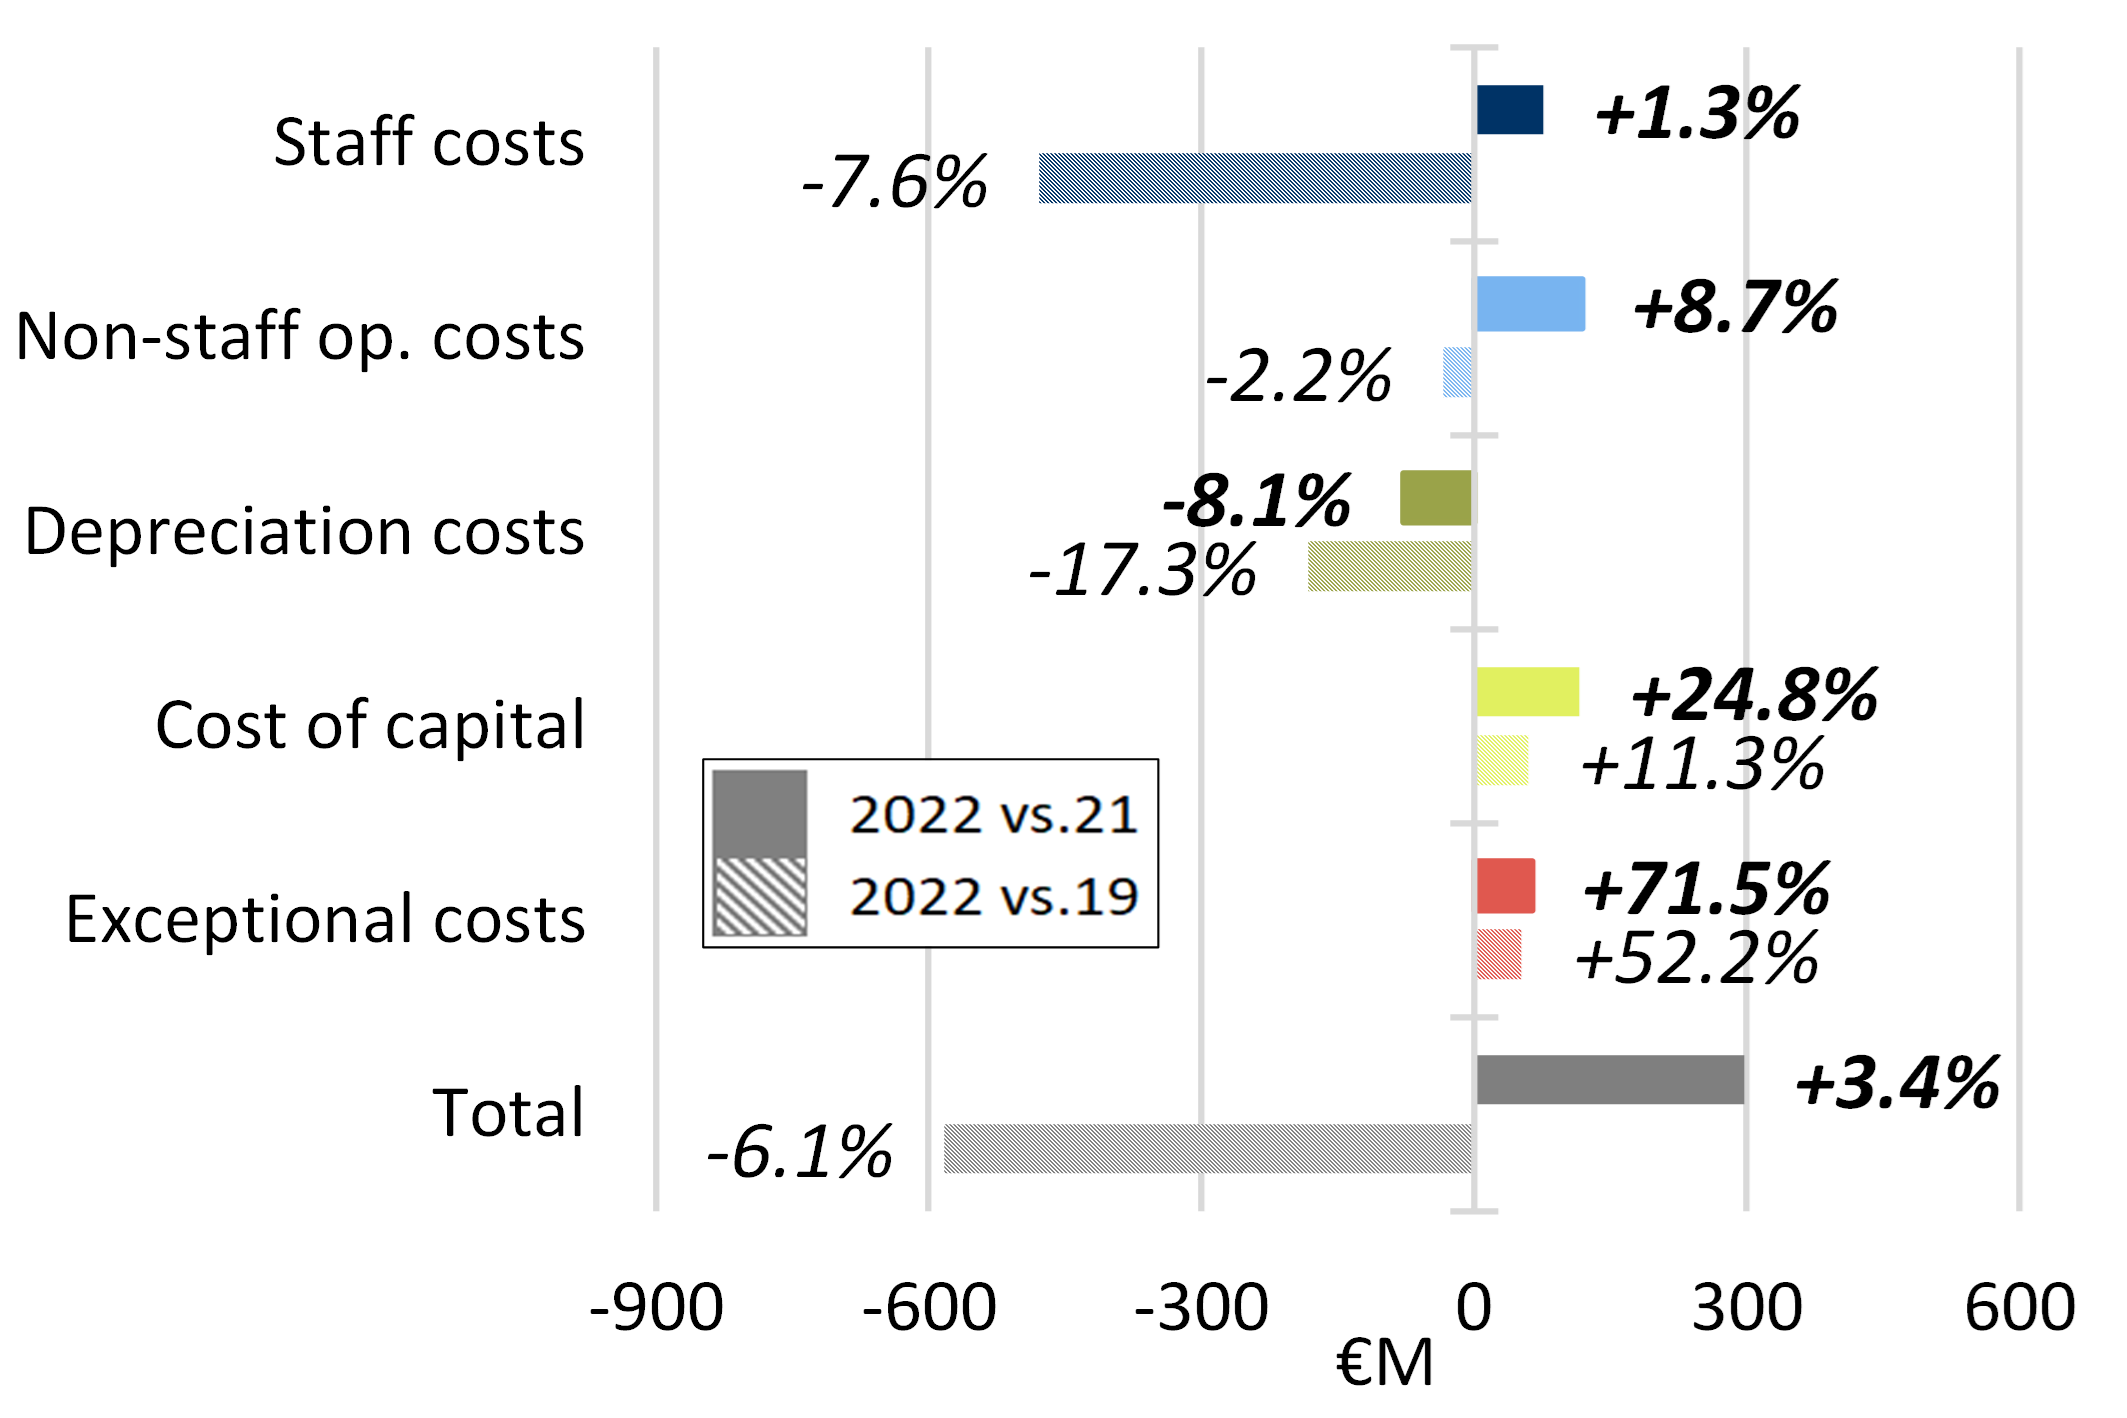
After two years of consecutive decreases, total ATM/CNS provision costs rose by +3.4% (+€296.8M) in 2022, reflecting cost increases for 26 out of 38 ANSPs. Non-staff operating costs (+€118.8M) and the cost of capital (+€115.7M) were the main sources of increase in 2022. The observed trend in the cost of capital is heavily affected by a very large increase for DHMI.
In 2022, the five largest ANSPs (DFS, DSNA, ENAIRE, ENAV and NATS) bore some 53% of the total Pan-European gate-to-gate ATM/CNS provision costs, while the five smallest ANSPs accounted for some 1% (see bottom left part of Figure 2.4).
Trends in ATM/CNS provision costs at Pan-European system level
The Pan-European ANSPs employed a total of 52 497 staff in 2022 (comprising 51 680 staff providing ATM/CNS services and 817 internal MET staff). Some 17 142 staff (33%) were ATCOs working on operational duties, split between ACCs (55%) and APP/TWR facilities (45%). On average, 2.0 additional staff are required for every ATCO in OPS in Europe.
In 2022, the number of ATM/CNS staff was slightly lower than in 2021 (-0.9% or -473 FTEs).
Trends in gate-to-gate ATM/CNS staff at Pan-European system level
The overall change in staff numbers observed for 2022 mainly reflects changes in the following staff categories:
- Administrative staff (-357 FTEs, or -4.1%);
- ATCOs in OPS (+356 FTEs, or +2.1%); and,
- ATCOs on other duties (-215 FTEs or -8.7%).
To some extent, the changes observed for the ATCOs categories may reflect the fact that some ATCOs previously reported as “on other duties” following the traffic decrease in 2020 and the COVID-19 pandemic, are now re-allocated to OPS duties.
Decreases are also observed for technical support staff for operational maintenance (-1.7%), OPS support staff (-2.0%), ab-initio trainees (-7.6%), ATC assistants (-3.1%), technical support staff for planning and development (-1.2%) and other staff (-0.2%). Conversely, the number of on-the job trainees (+8.9%) and staff for ancillary services (+2.2%) rose in 2022.