4 Financial cost-effectiveness
This chapter provides a preliminary analysis of financial cost-effectiveness.
4.1 Pan-European system level
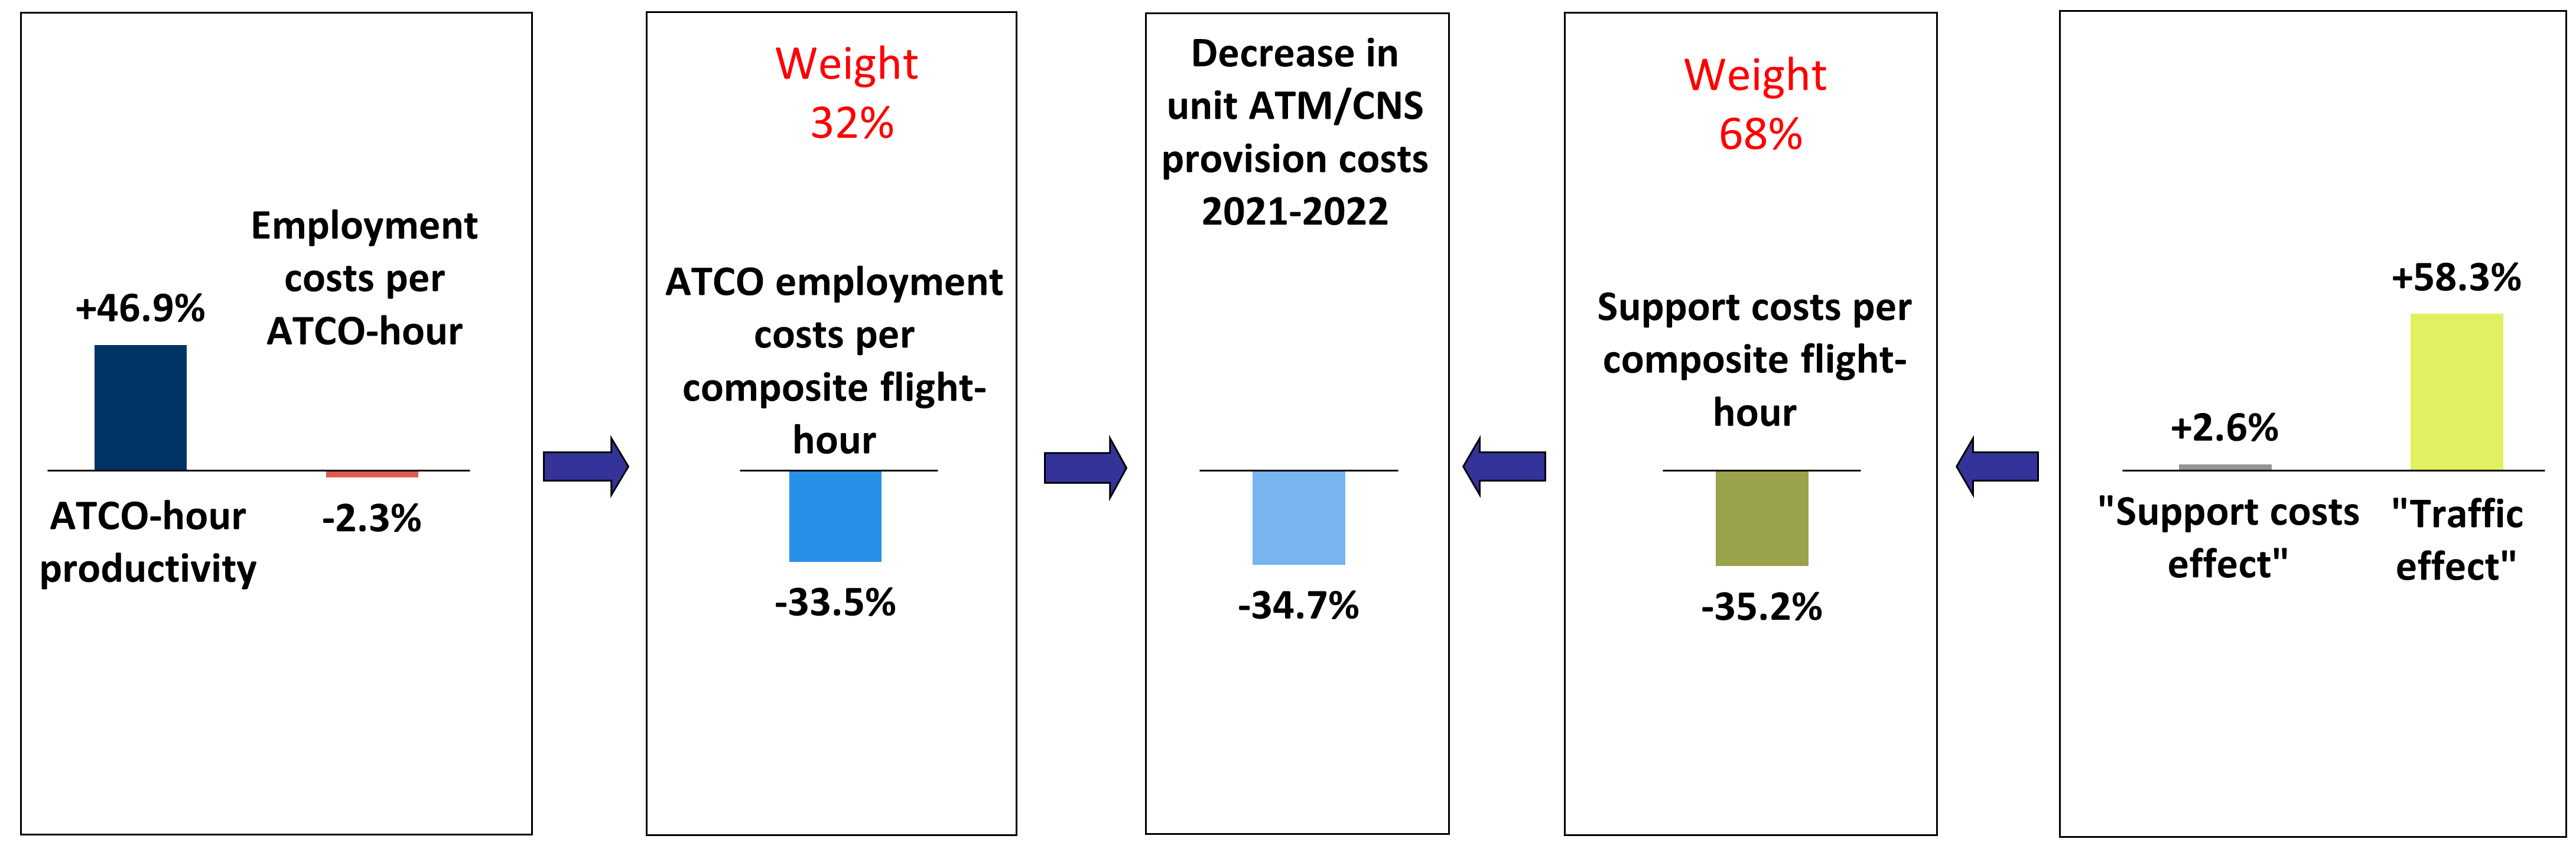
Figure 4.1 shows that in 2022 the unit ATM/CNS provision costs fell by -34.7% compared to 2021, reaching an amount of €470. This is the result of traffic increase (+58.3%) coupled with the growth of ATM/CNS provision costs (+3.4%).
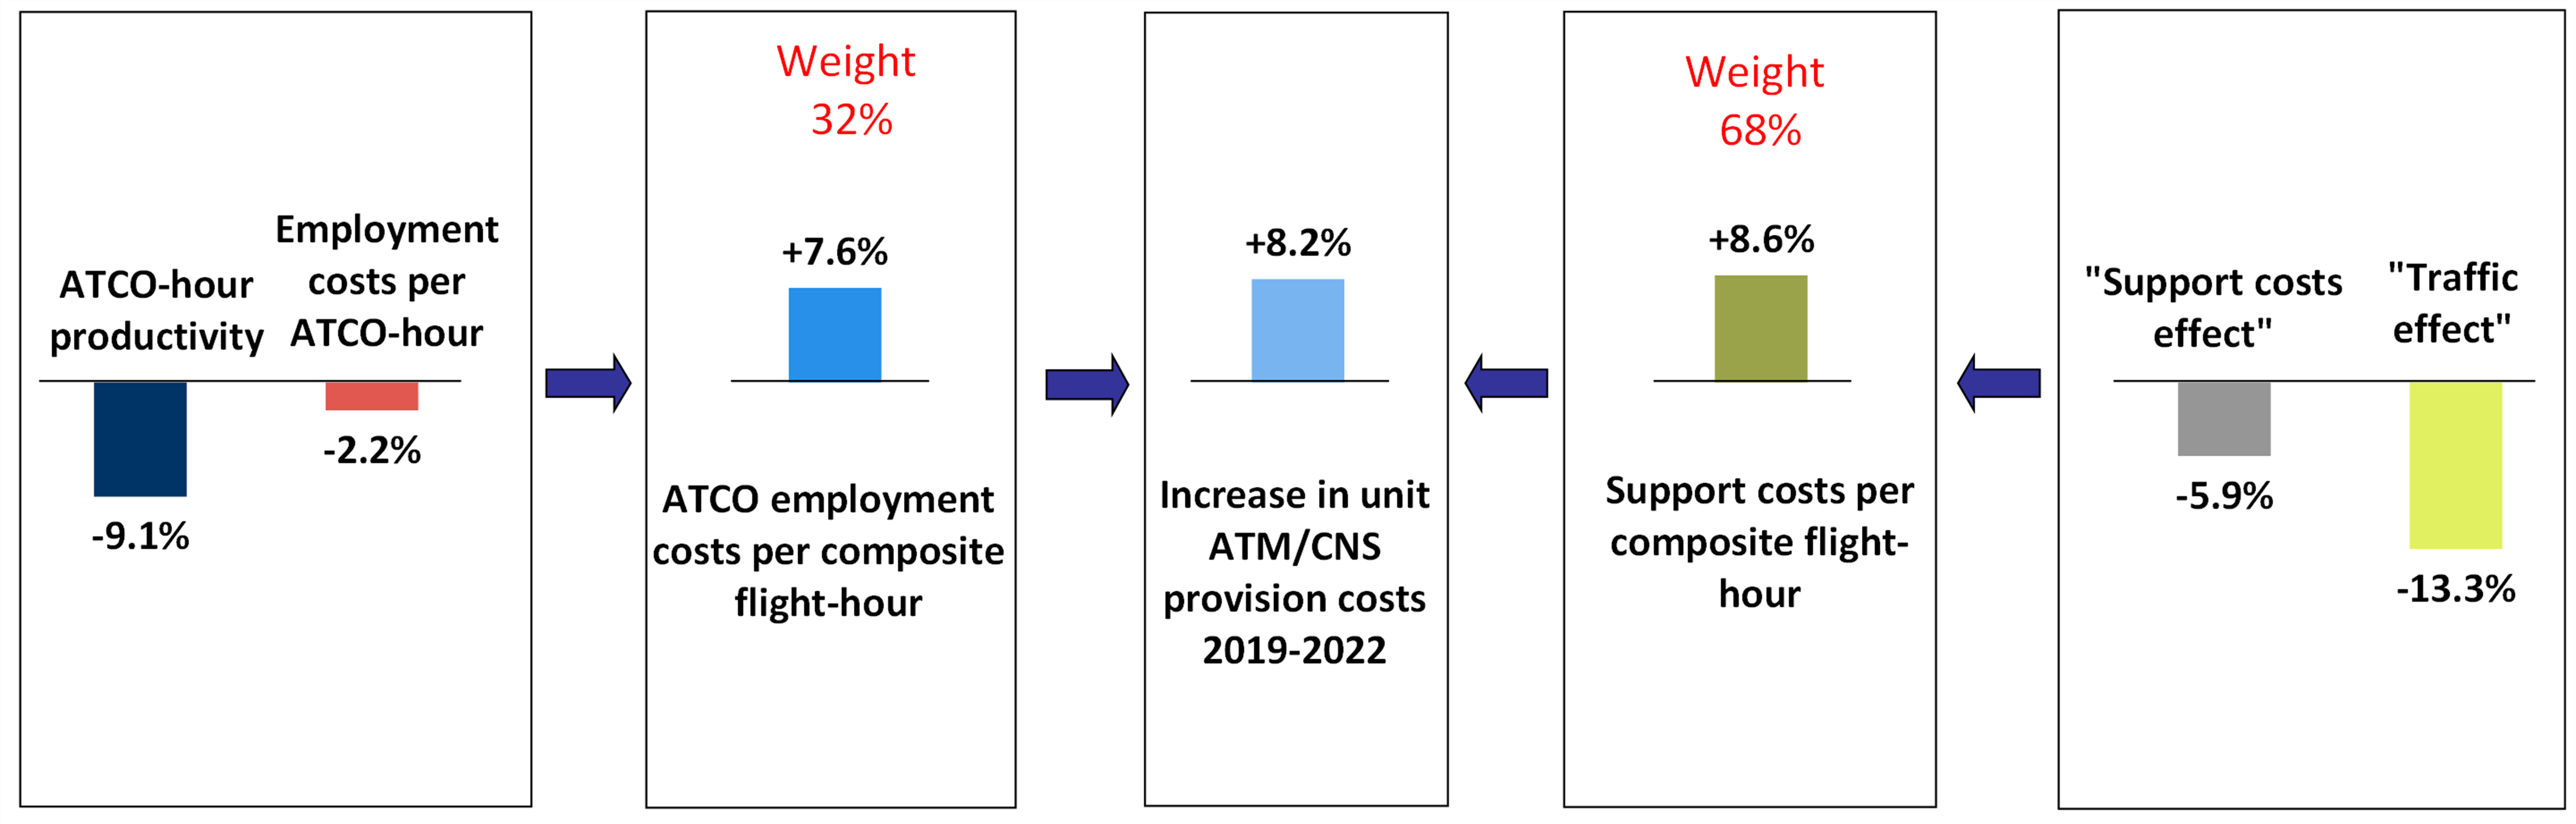
However, Comparing with pre-pandemic levels, in 2022 unit ATM/CNS provision costs still remain +8.2% higher than in 2019. This mainly reflects the fact that, despite a lower cost-base (-6.1% compared to 2019) traffic volumes in 2022 still did not reach the 2019 level (-13.3%).
The analytical framework used in the ACE analysis to break down the financial cost-effectiveness indicator into relevant economic drivers is presented in Figure 4.2. These key drivers include:
a) ATCO-hour productivity (0.88 composite flight-hours per ATCO-hour);
b) ATCO employment costs per ATCO-hour (€133); and,
c) support costs per unit output (€319).
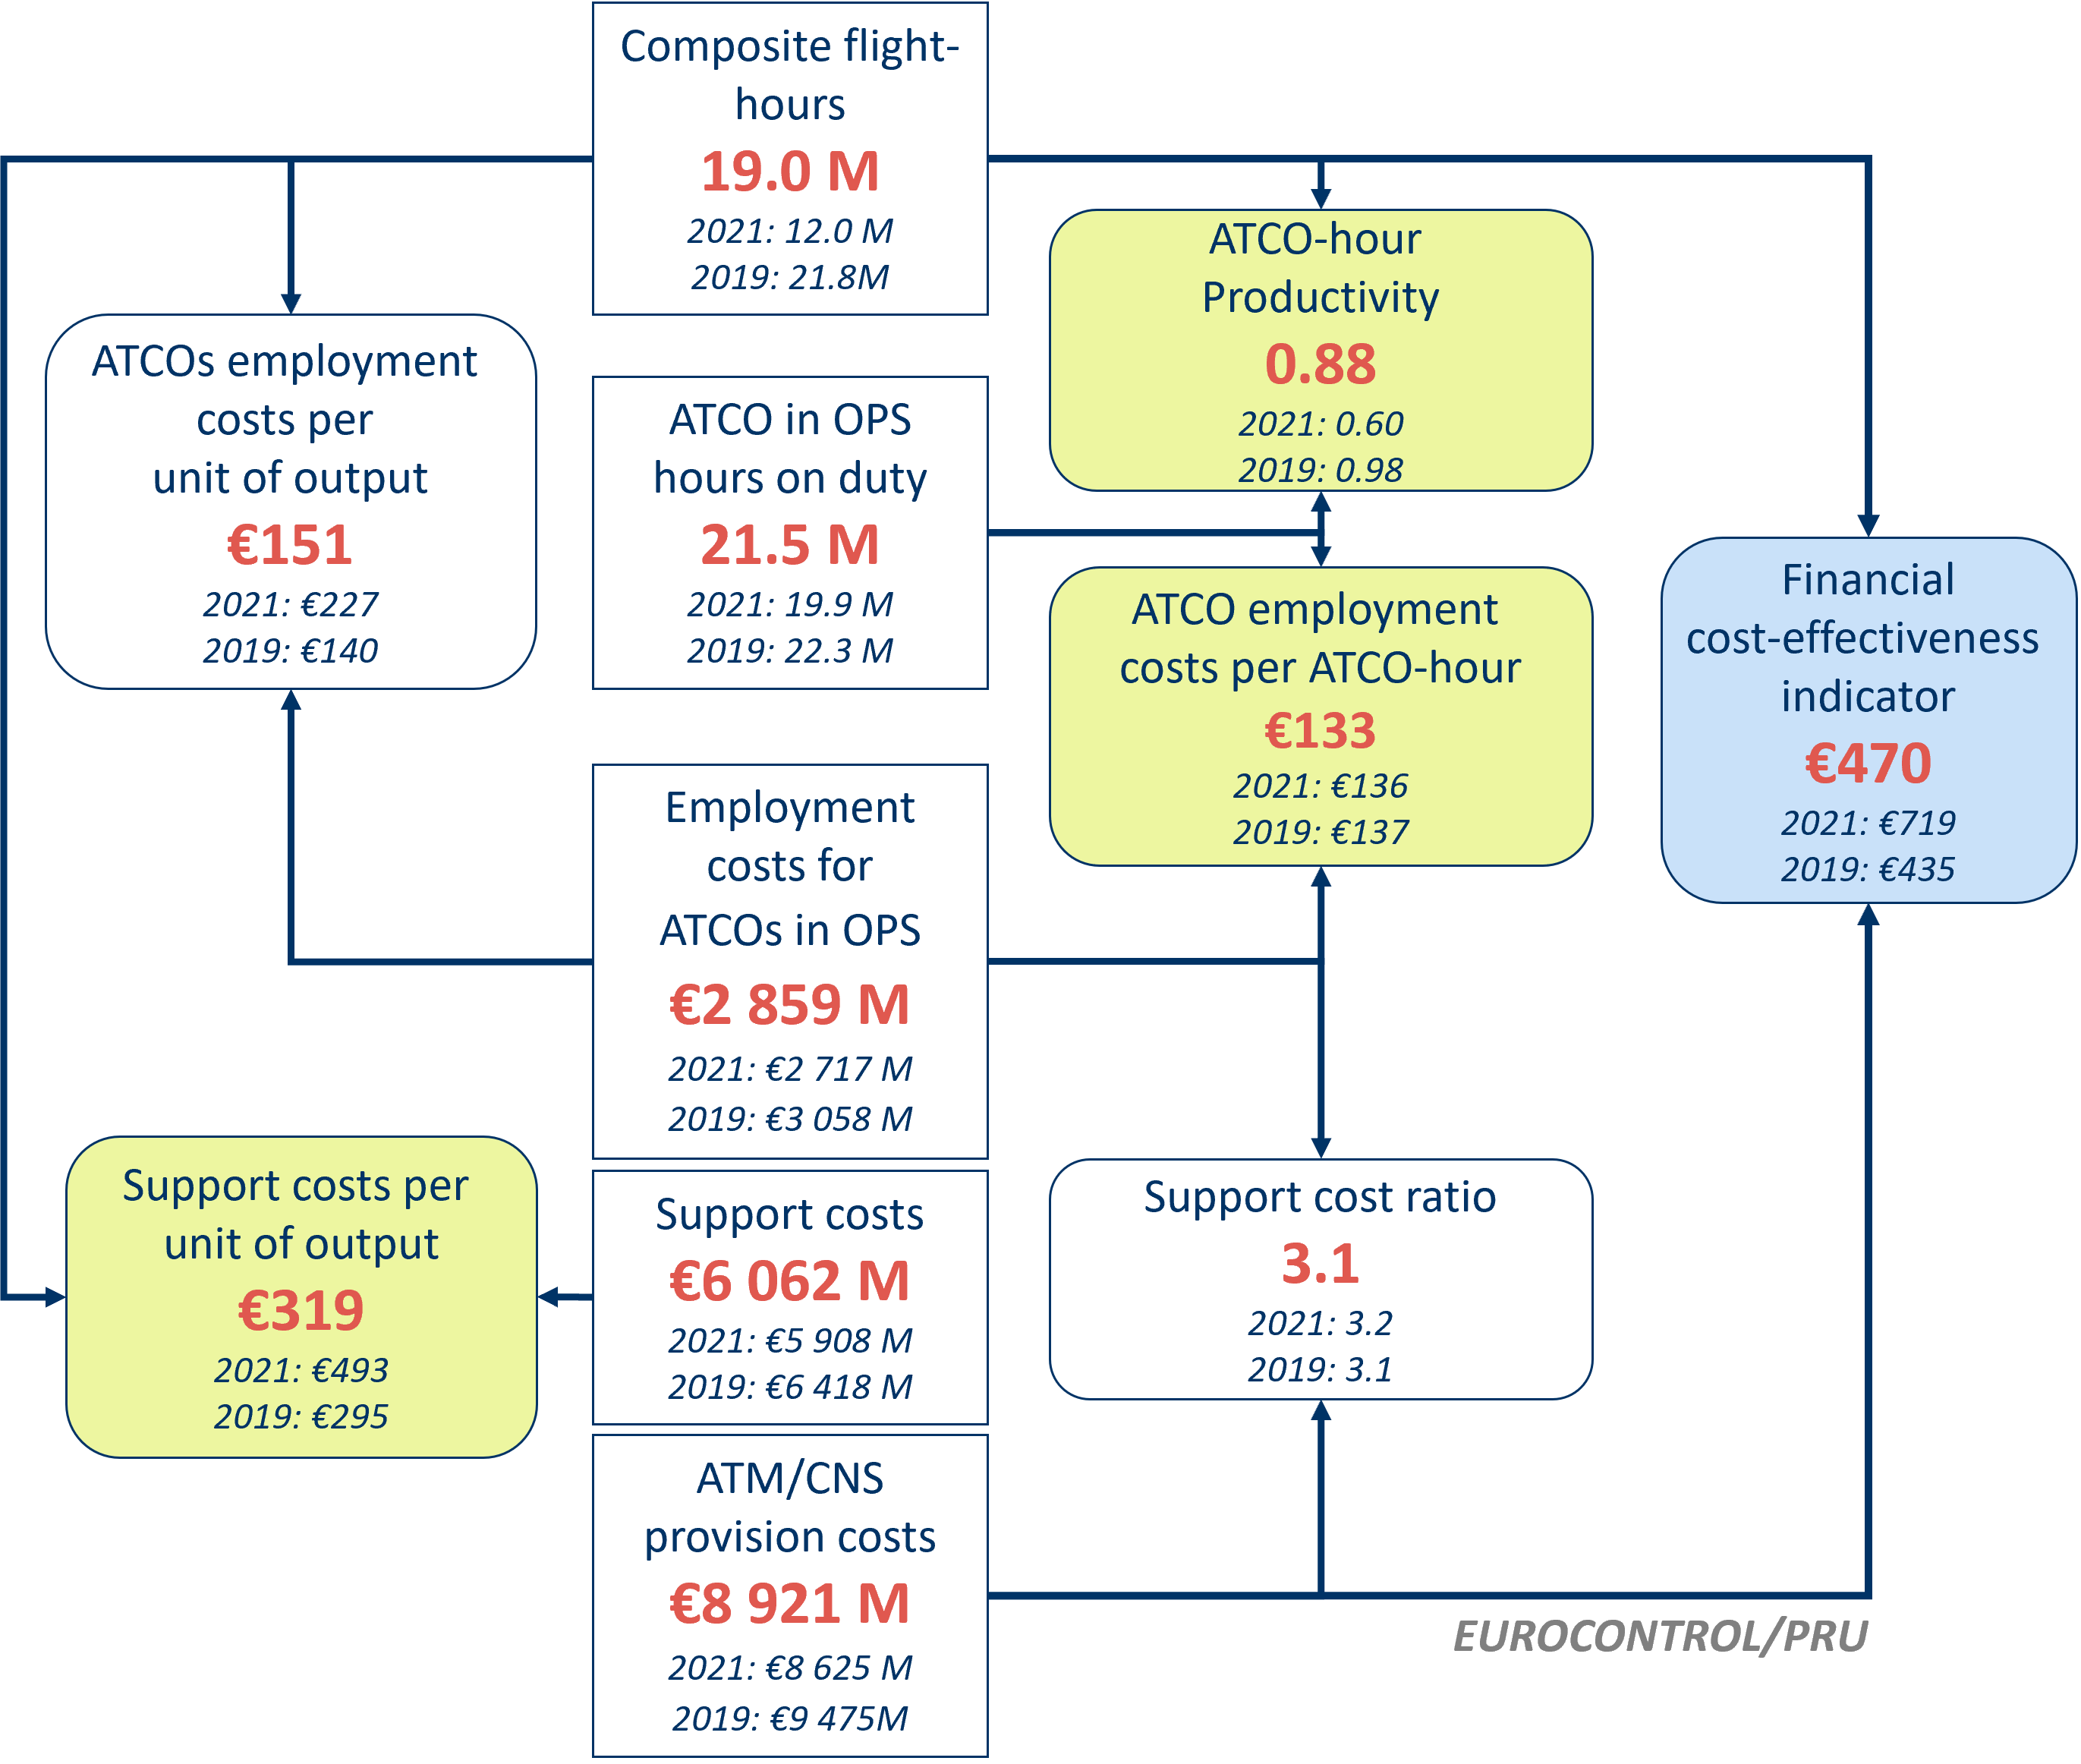
Figure 4.3 shows that in 2022, ATCO employment costs per ATCO-hour fell by -2.3% while ATCO-hour productivity rose by +46.9%. As a result, ATCO employment costs per composite flight-hour decreased (-33.5%). In the meantime, unit support costs fell by -35.2% due to the combination of an increase in composite flight-hours (+58.3%) and an increase in support costs (+2.6%). As a result, in 2022, unit ATM/CNS provision costs fell by -34.7% at Pan-European system level.
As the values of the 2021 indicators were significantly affected by the consequences of the COVID-19 crisis, Figure 4.4 below provides an additional analysis using 2019 as a reference year. It shows that in 2022 the traffic was still well below its 2019 level and, despite a reduction in total support costs, the unit support costs were higher than in 2019. A similar situation is observed on the ATCO employment costs side where the reduction in employment costs per ATCO-hour was not sufficient to compensate for the decrease in ATCO-hour productivity. Overall, the unit cost in 2022 was then +8.2% higher than in 2019.
4.2 ANSP level
All figures presented in this section present the preliminary benchmarking results for the 38 ANSPs. Because of their weight in the Pan-European system and their relatively similar operational and economic characteristics, the five largest ANSPs (DFS, DSNA, ENAIRE, ENAV and NATS) are also shown in a miniature replica of the chart (top right corner of the figures). The 1st and 3rd quartiles for each indicator are also shown in all figures. The gap between these two quartiles provides additional insight on the dispersion of the values.
Figure 4.5 presents the financial gate-to-gate cost-effectiveness indicator at ANSP level for the year 2022. The dotted lines represent the 1st and 3rd quartiles (€360 and €518, respectively).
Figure 4.6 presents the ATCO-hour productivity indicator at ANSP level for the year 2022. The dotted lines represent the 1st and 3rd quartiles (0.61 and 0.93, respectively).
Figure 4.7 presents the employment costs per ATCO in OPS indicator at ANSP level for the year 2022. The dotted lines represent the 1st and 3rd quartiles (€58 and €141, respectively).
Figure 4.8 presents the support costs per composite flight-hour indicator at ANSP level for the year 2022. The dotted lines represent the 1st and 3rd quartiles (€243 and €382, respectively).
A more detailed analysis of the changes in cost-effectiveness, ATCO-hour productivity, ATCO employment costs per ATCO-hour and unit support costs will be available in the final ACE benchmarking report.