Traffic Characterization
The COVID-19 pandemic hit all countries worldwide, but at different moments. In Europe, the first case was registered in January 24, 2020, in France. The first patient in Brazil was officially announced almost one month later in February 26, 2020. Beginning of March the global dimension of the spread of the infections became apparent. In March 11, 2020, the World Health Organization declared the crisis a “global pandemic.” This resulted in many governments imposing travel restrictions for both national and international traffic
Regional Air Traffic
Figure 0.2 shows the regional traffic development in Brazil and Europe. In non-disturbed times air traffic in Brazil shows only mild variation across the year. This is in contrast to the strong seasonal nature of air traffic in Europe in 2019 peaking during the summer months. In both regions, the unprecedented decline in air traffic occurred in the aftermath of the declaration by the WHO.
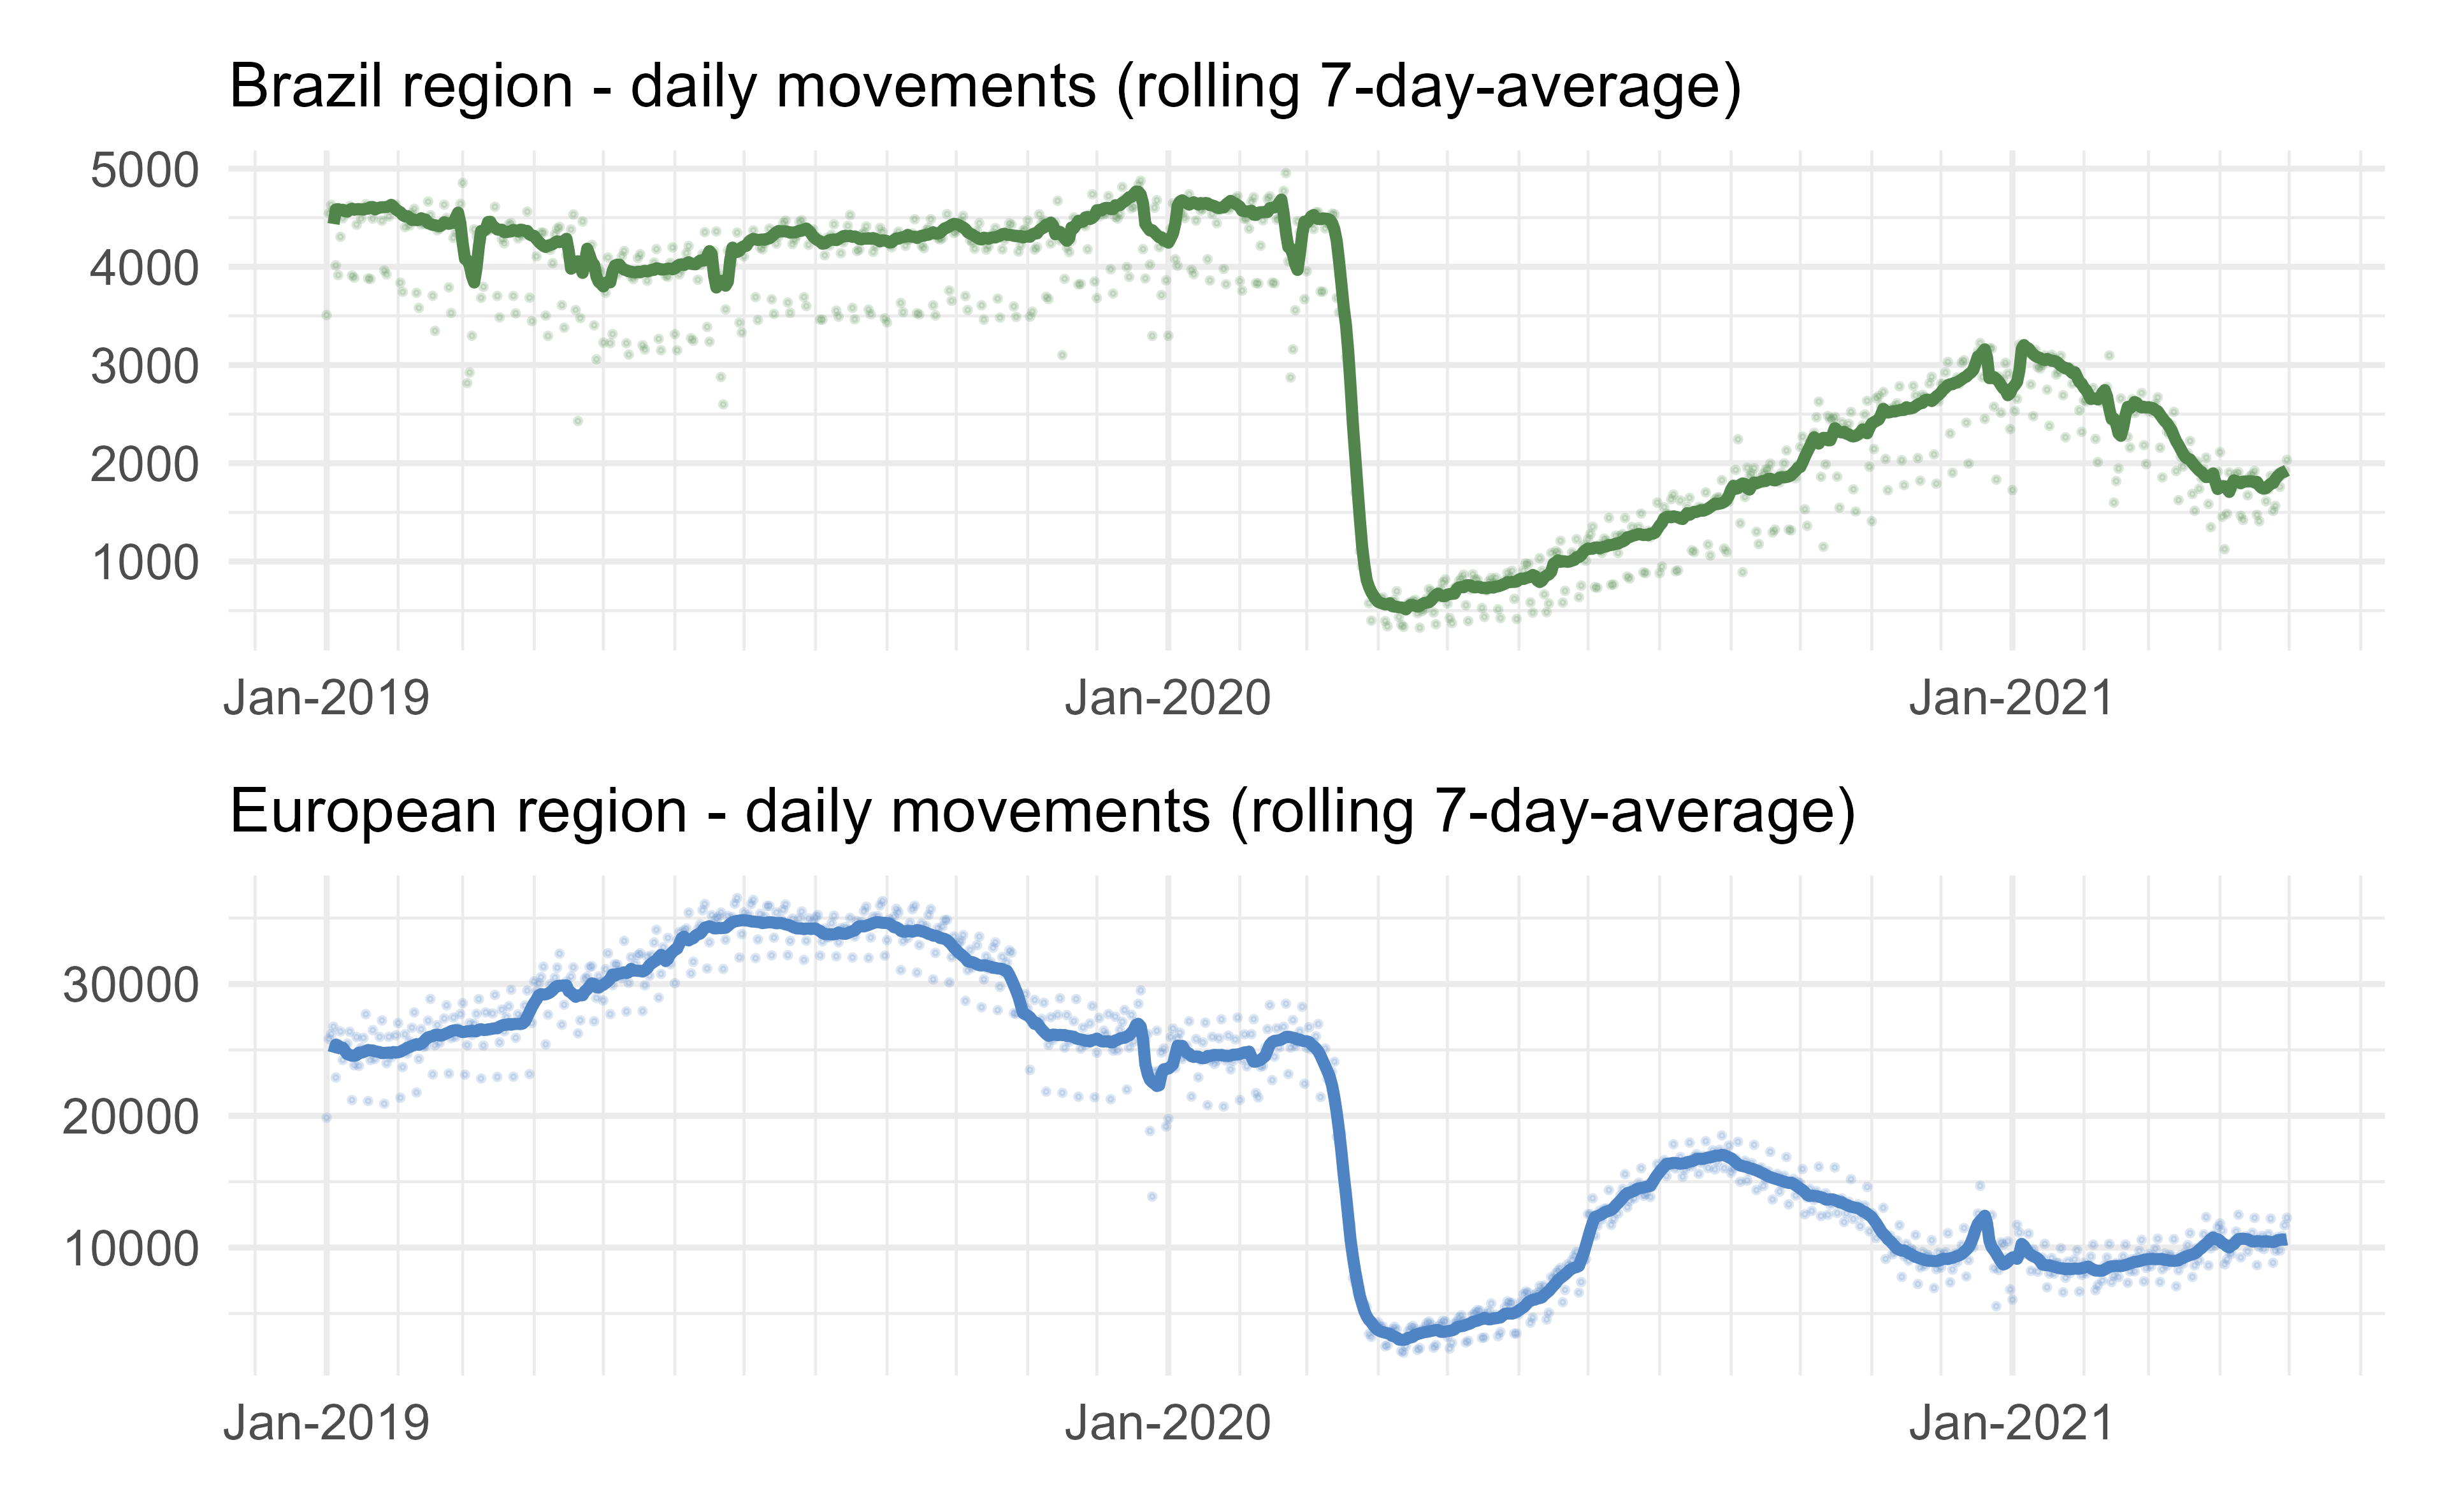
Figure 0.2: Regional daily air traffic
To understand the magnitude of the impact, Fig. 0.3 depicts the regional traffic in a normalised form. The reference level for the normalisation is set at the 90th percentile of traffic observed in 2019. The initial drop in traffic starts a few days earlier in Europe. This is related to the reaction of several air transport operators to limit their flights to Asia and some European states already reacting to the surge of infections and the anticipated declaration of the WHO.
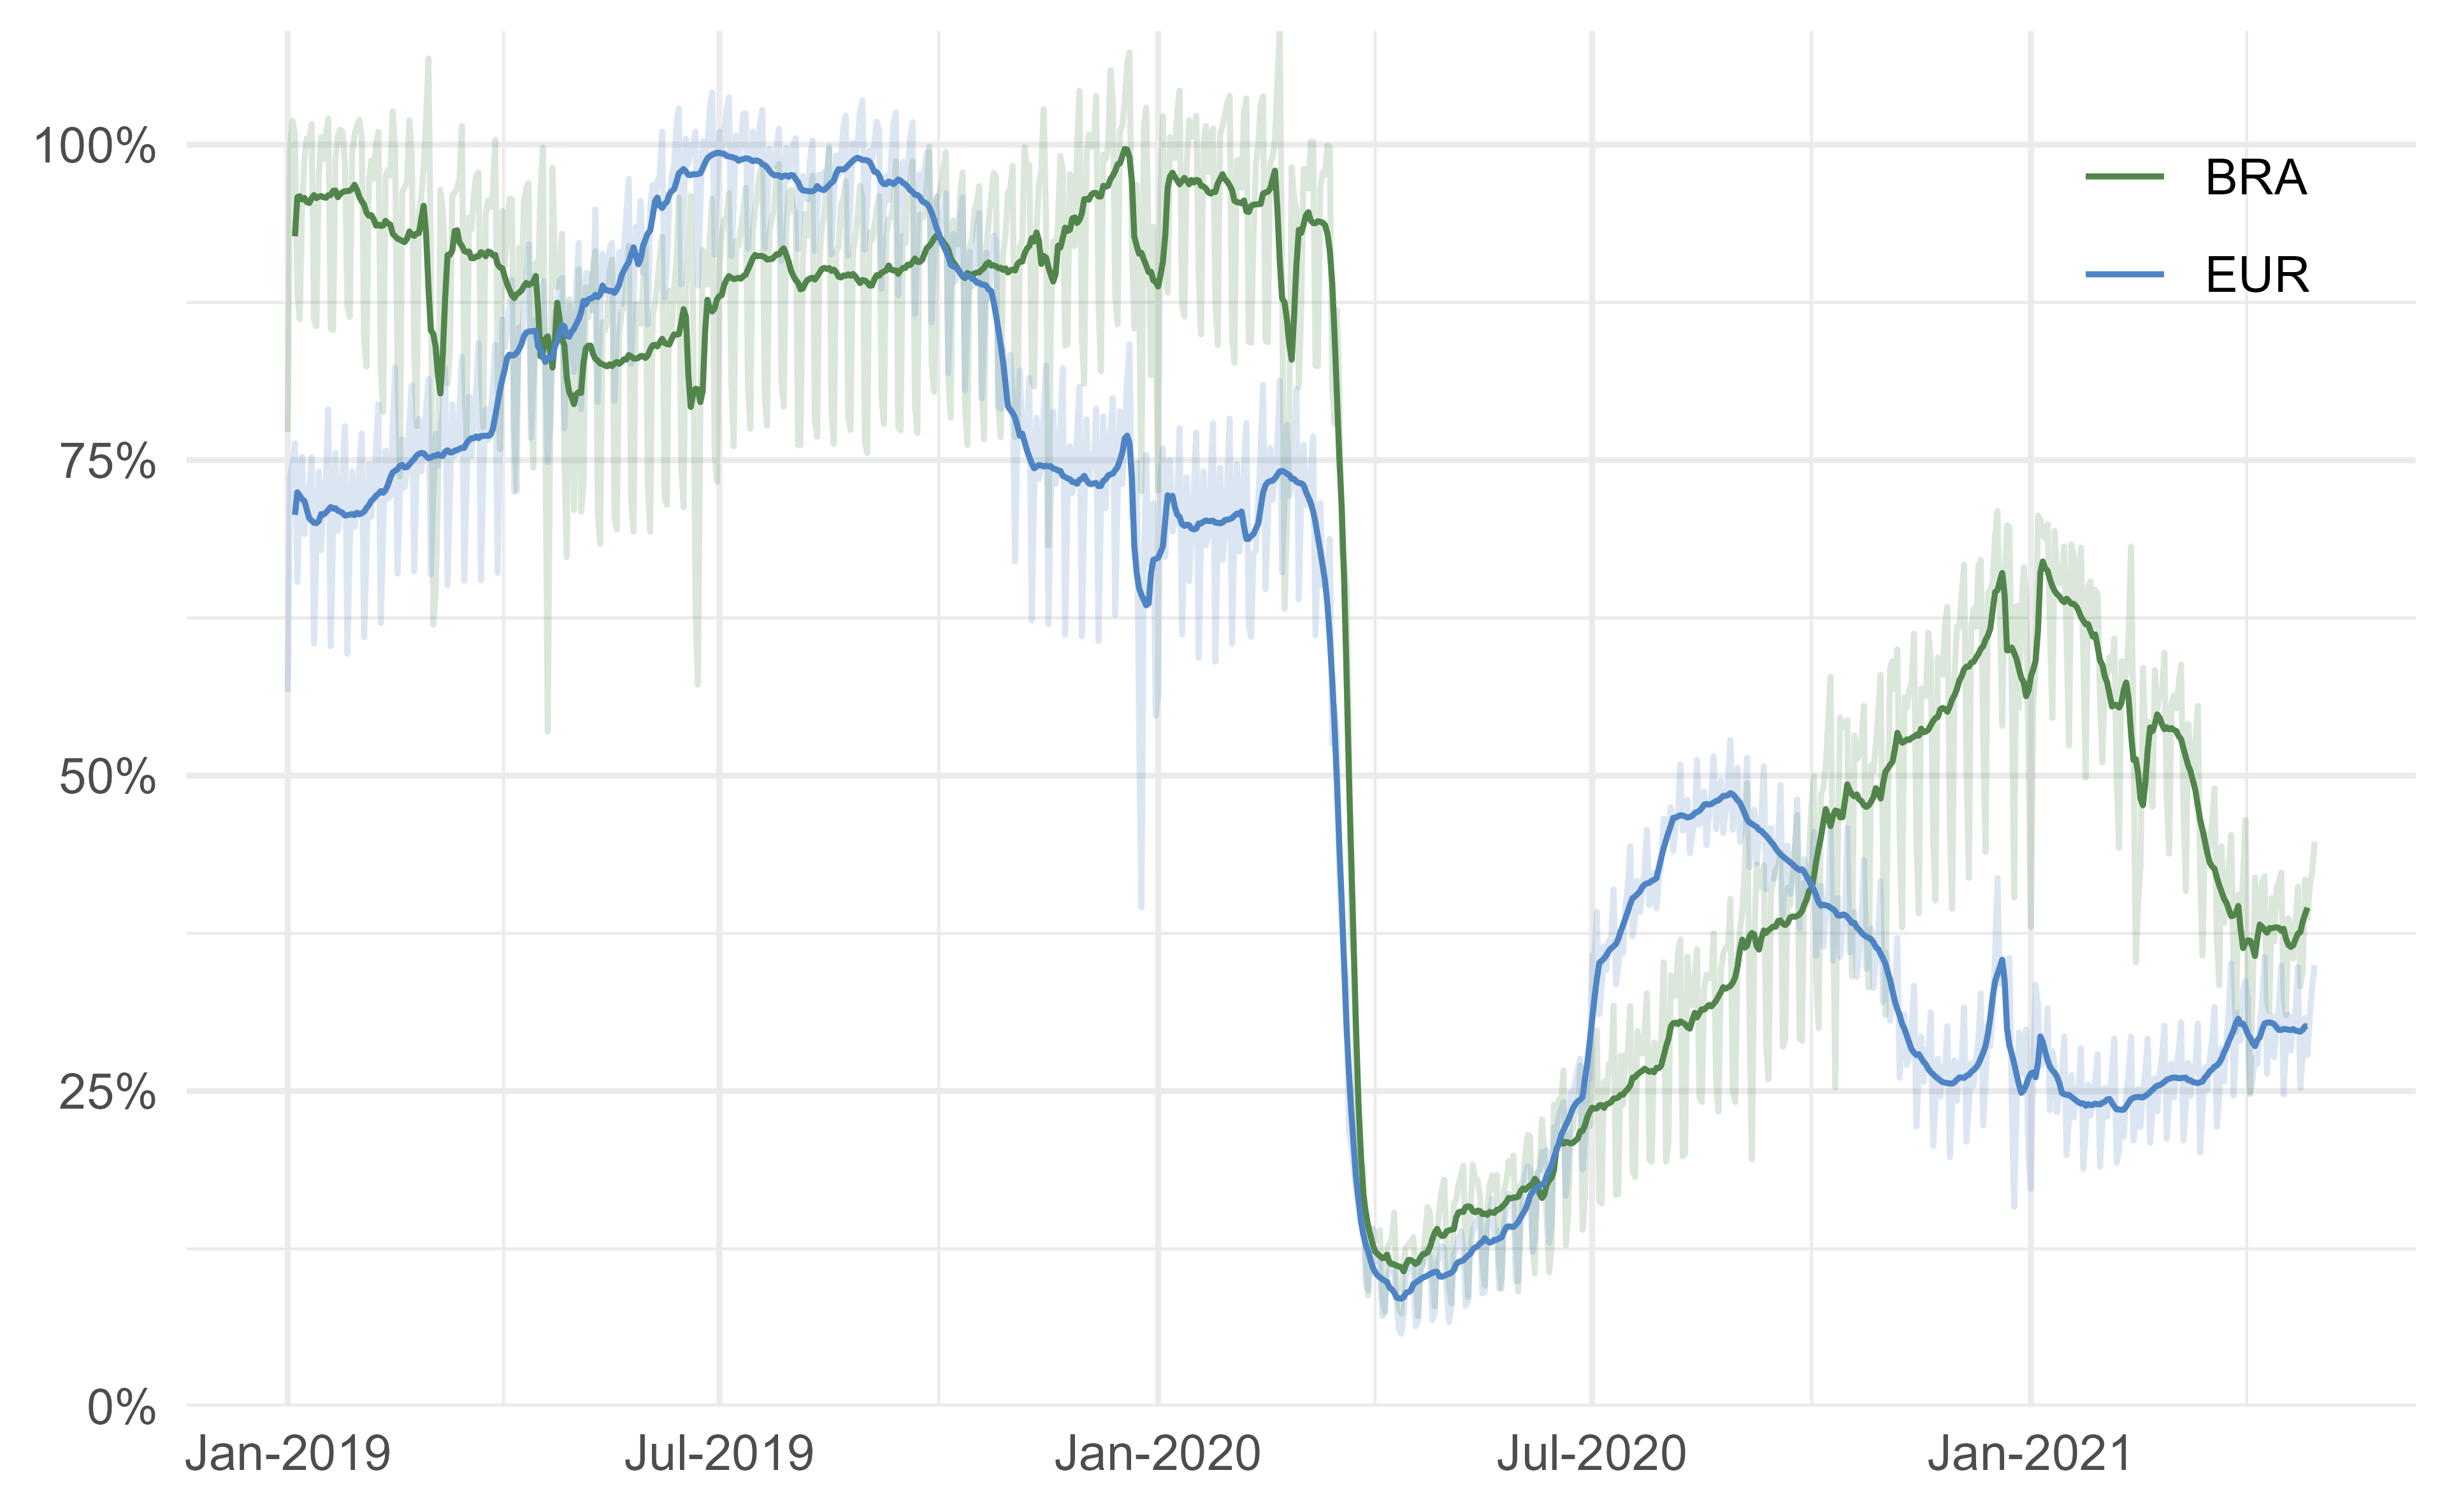
Figure 0.3: Normalised daily traffic in Brazil and Europe
The traffic declined in both regions in the order of magnitude of about 90% following the immediate drop of traffic due to the world wide air traffic restrictions. While the initial response to the drop shows a similar pattern, Europe has seen a higher share of traffic in June, July and August. Traffic in Brazil grew gradually and consistently in 2020. Europe was facing a 2nd wave of infections with the summer season and governments had to impose restrictions on the regional traffic. In both regions the spike of seasonal Christmas and New Year’s traffic is visible. A significant change in the pattern developed with the beginning of 2021. With Europe seeing now a continual increase in air traffic in sync with the increasing rate of vaccinations, Brazil faces another wave and sees a distinct decline in regional air transportation.
Study Airport Level Traffic
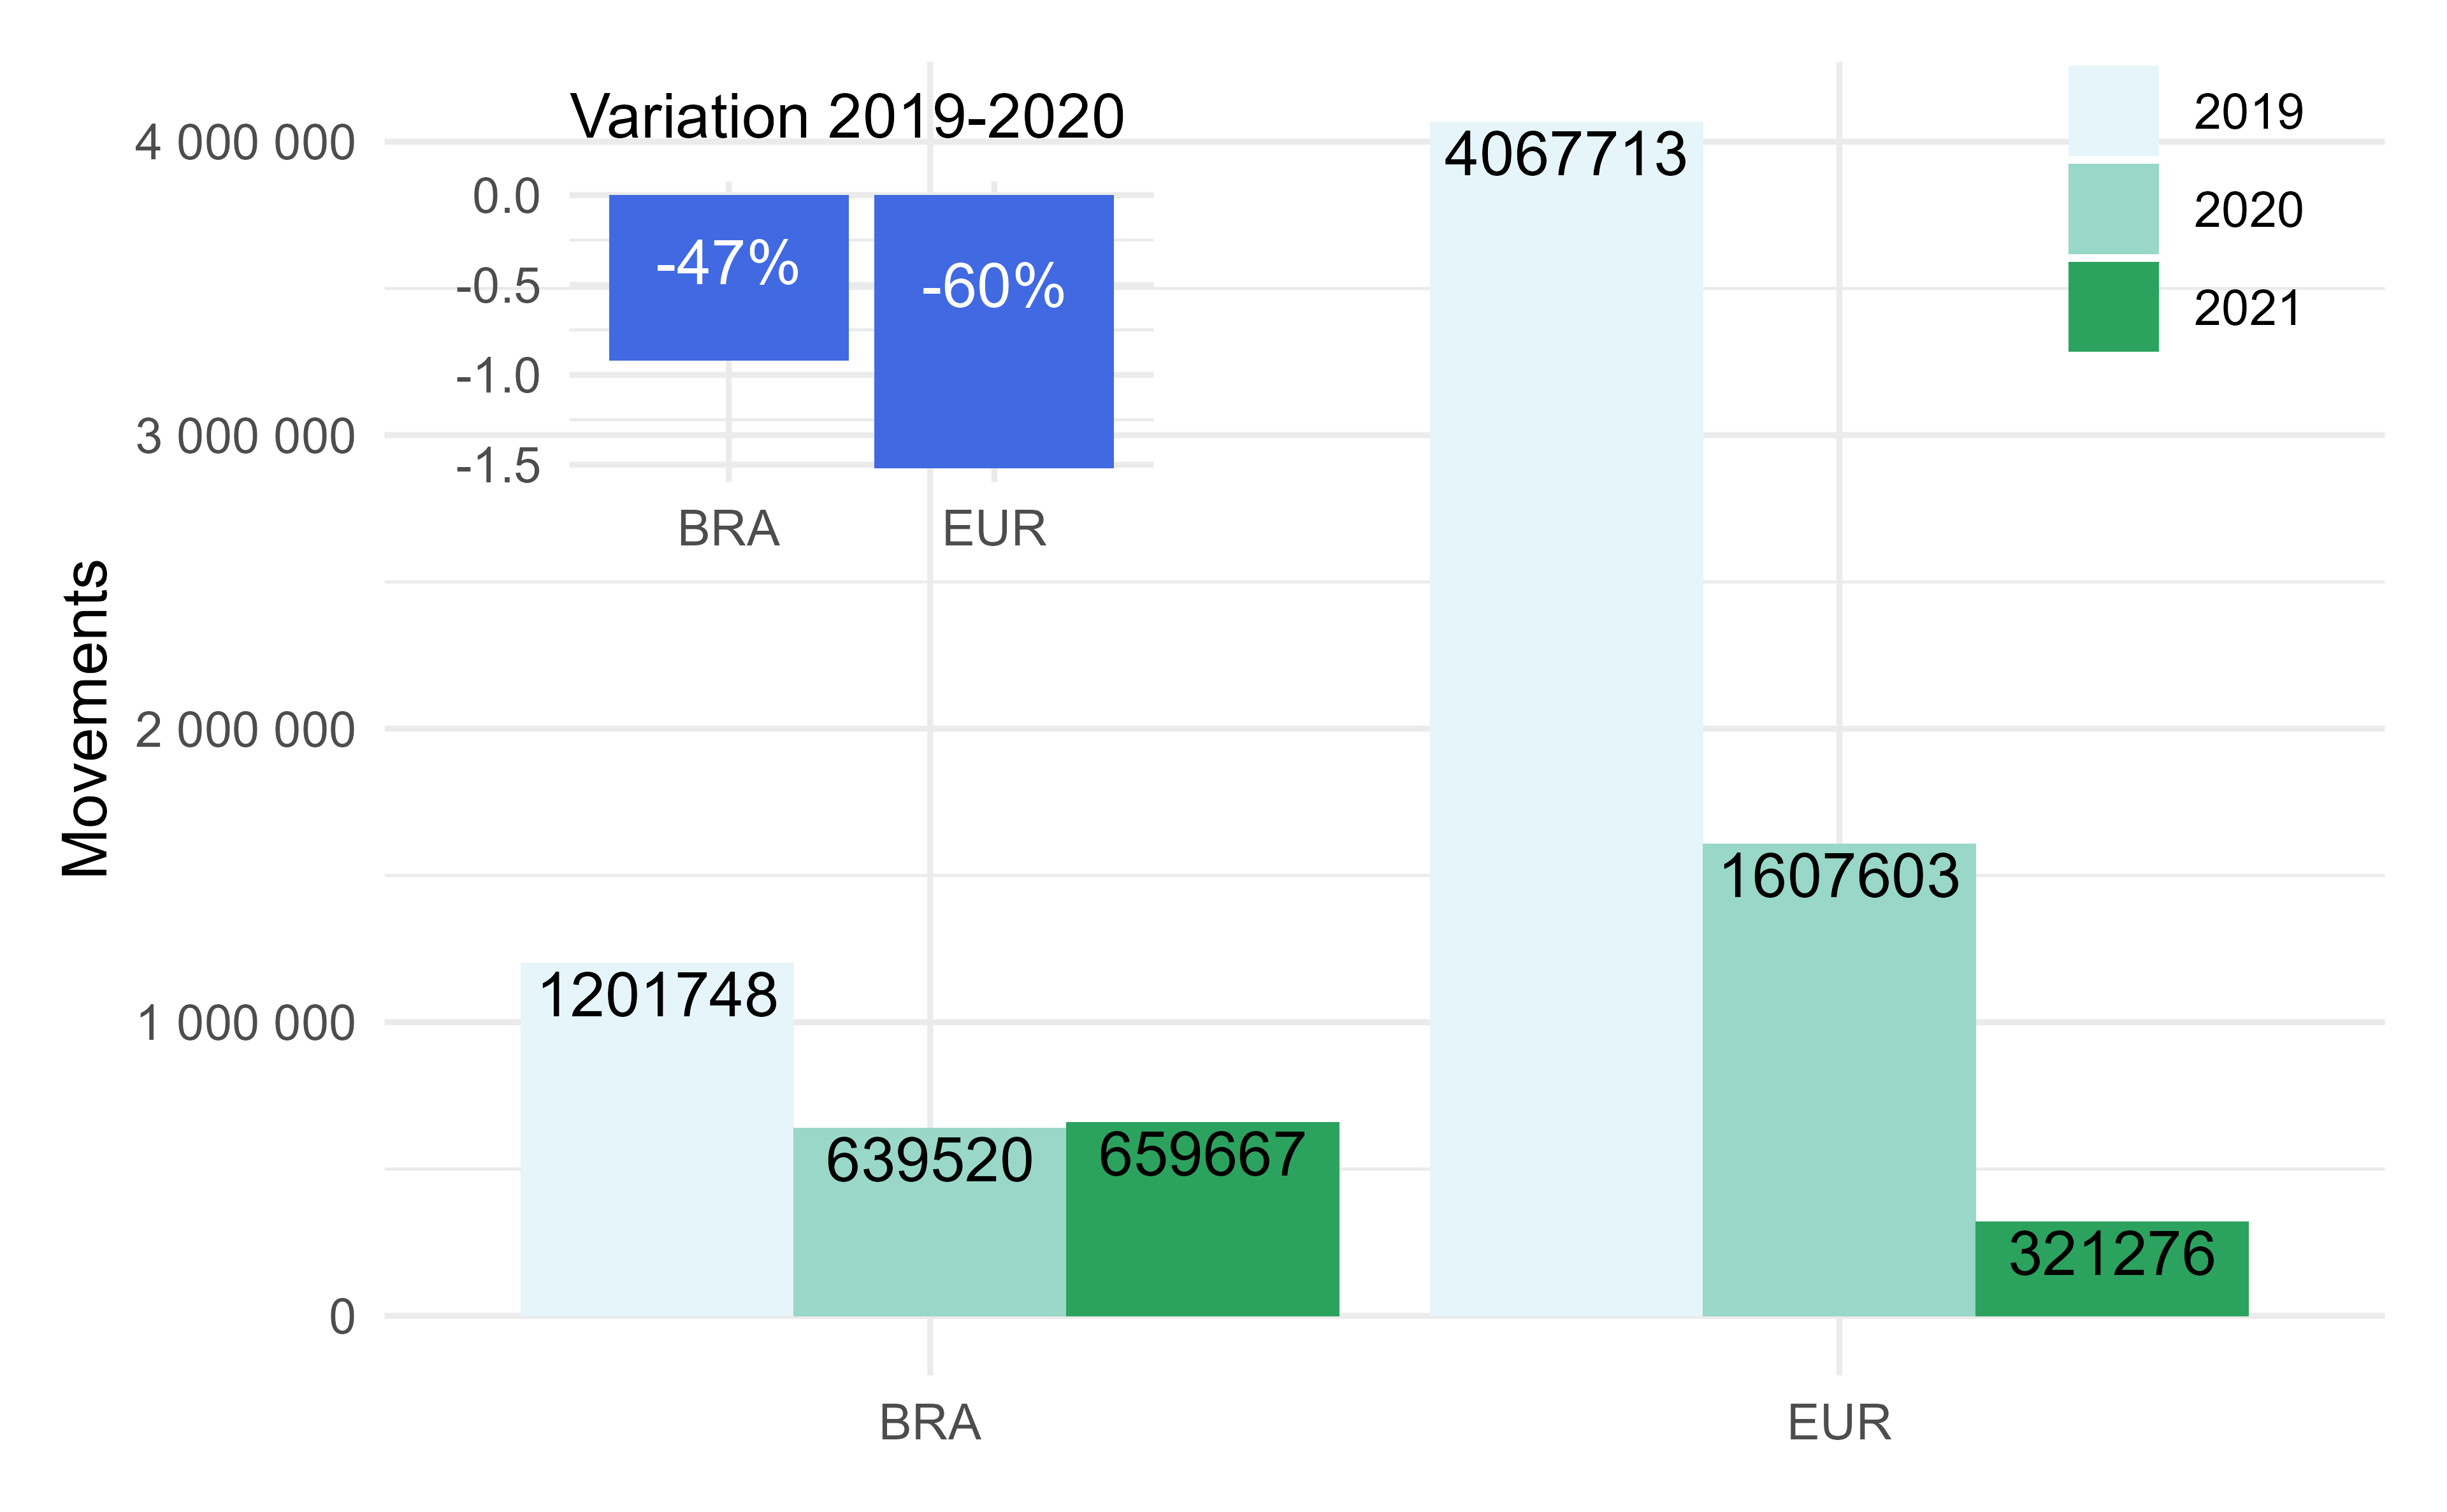
Figure 0.4: Movements at study airports in both regions.
Figure 0.4 shows the variation of air traffic across the study airports. The decrease of traffic at the top-10 airports in Europe was about 13% higher than in Brazil when comparing the observed traffic in 2019 and 2020. The overall numbers are characteristic for the decline in traffic seen on the network level. The traffic count displayed for 2021 reflects the traffic at the study airports for the first months of 2021. This value should not be confused with the shown total annual values for 2019 and 2020.
Daily Traffic at the Top-10 Airports
When comparing the traffic development at the top-10 airports in both regions, a refined pattern emerges. Figure 0.5 shows the daily movements at these airports. The aggregated traffic at these airports in Brazil ranges just under 50% of the traffic levels observed in Europe during the winter season. The sesonality of traffic in Europe is contrasted by the homogeneous demand levels in Brazil. Similar levels have been observed in the first two months of 2021.
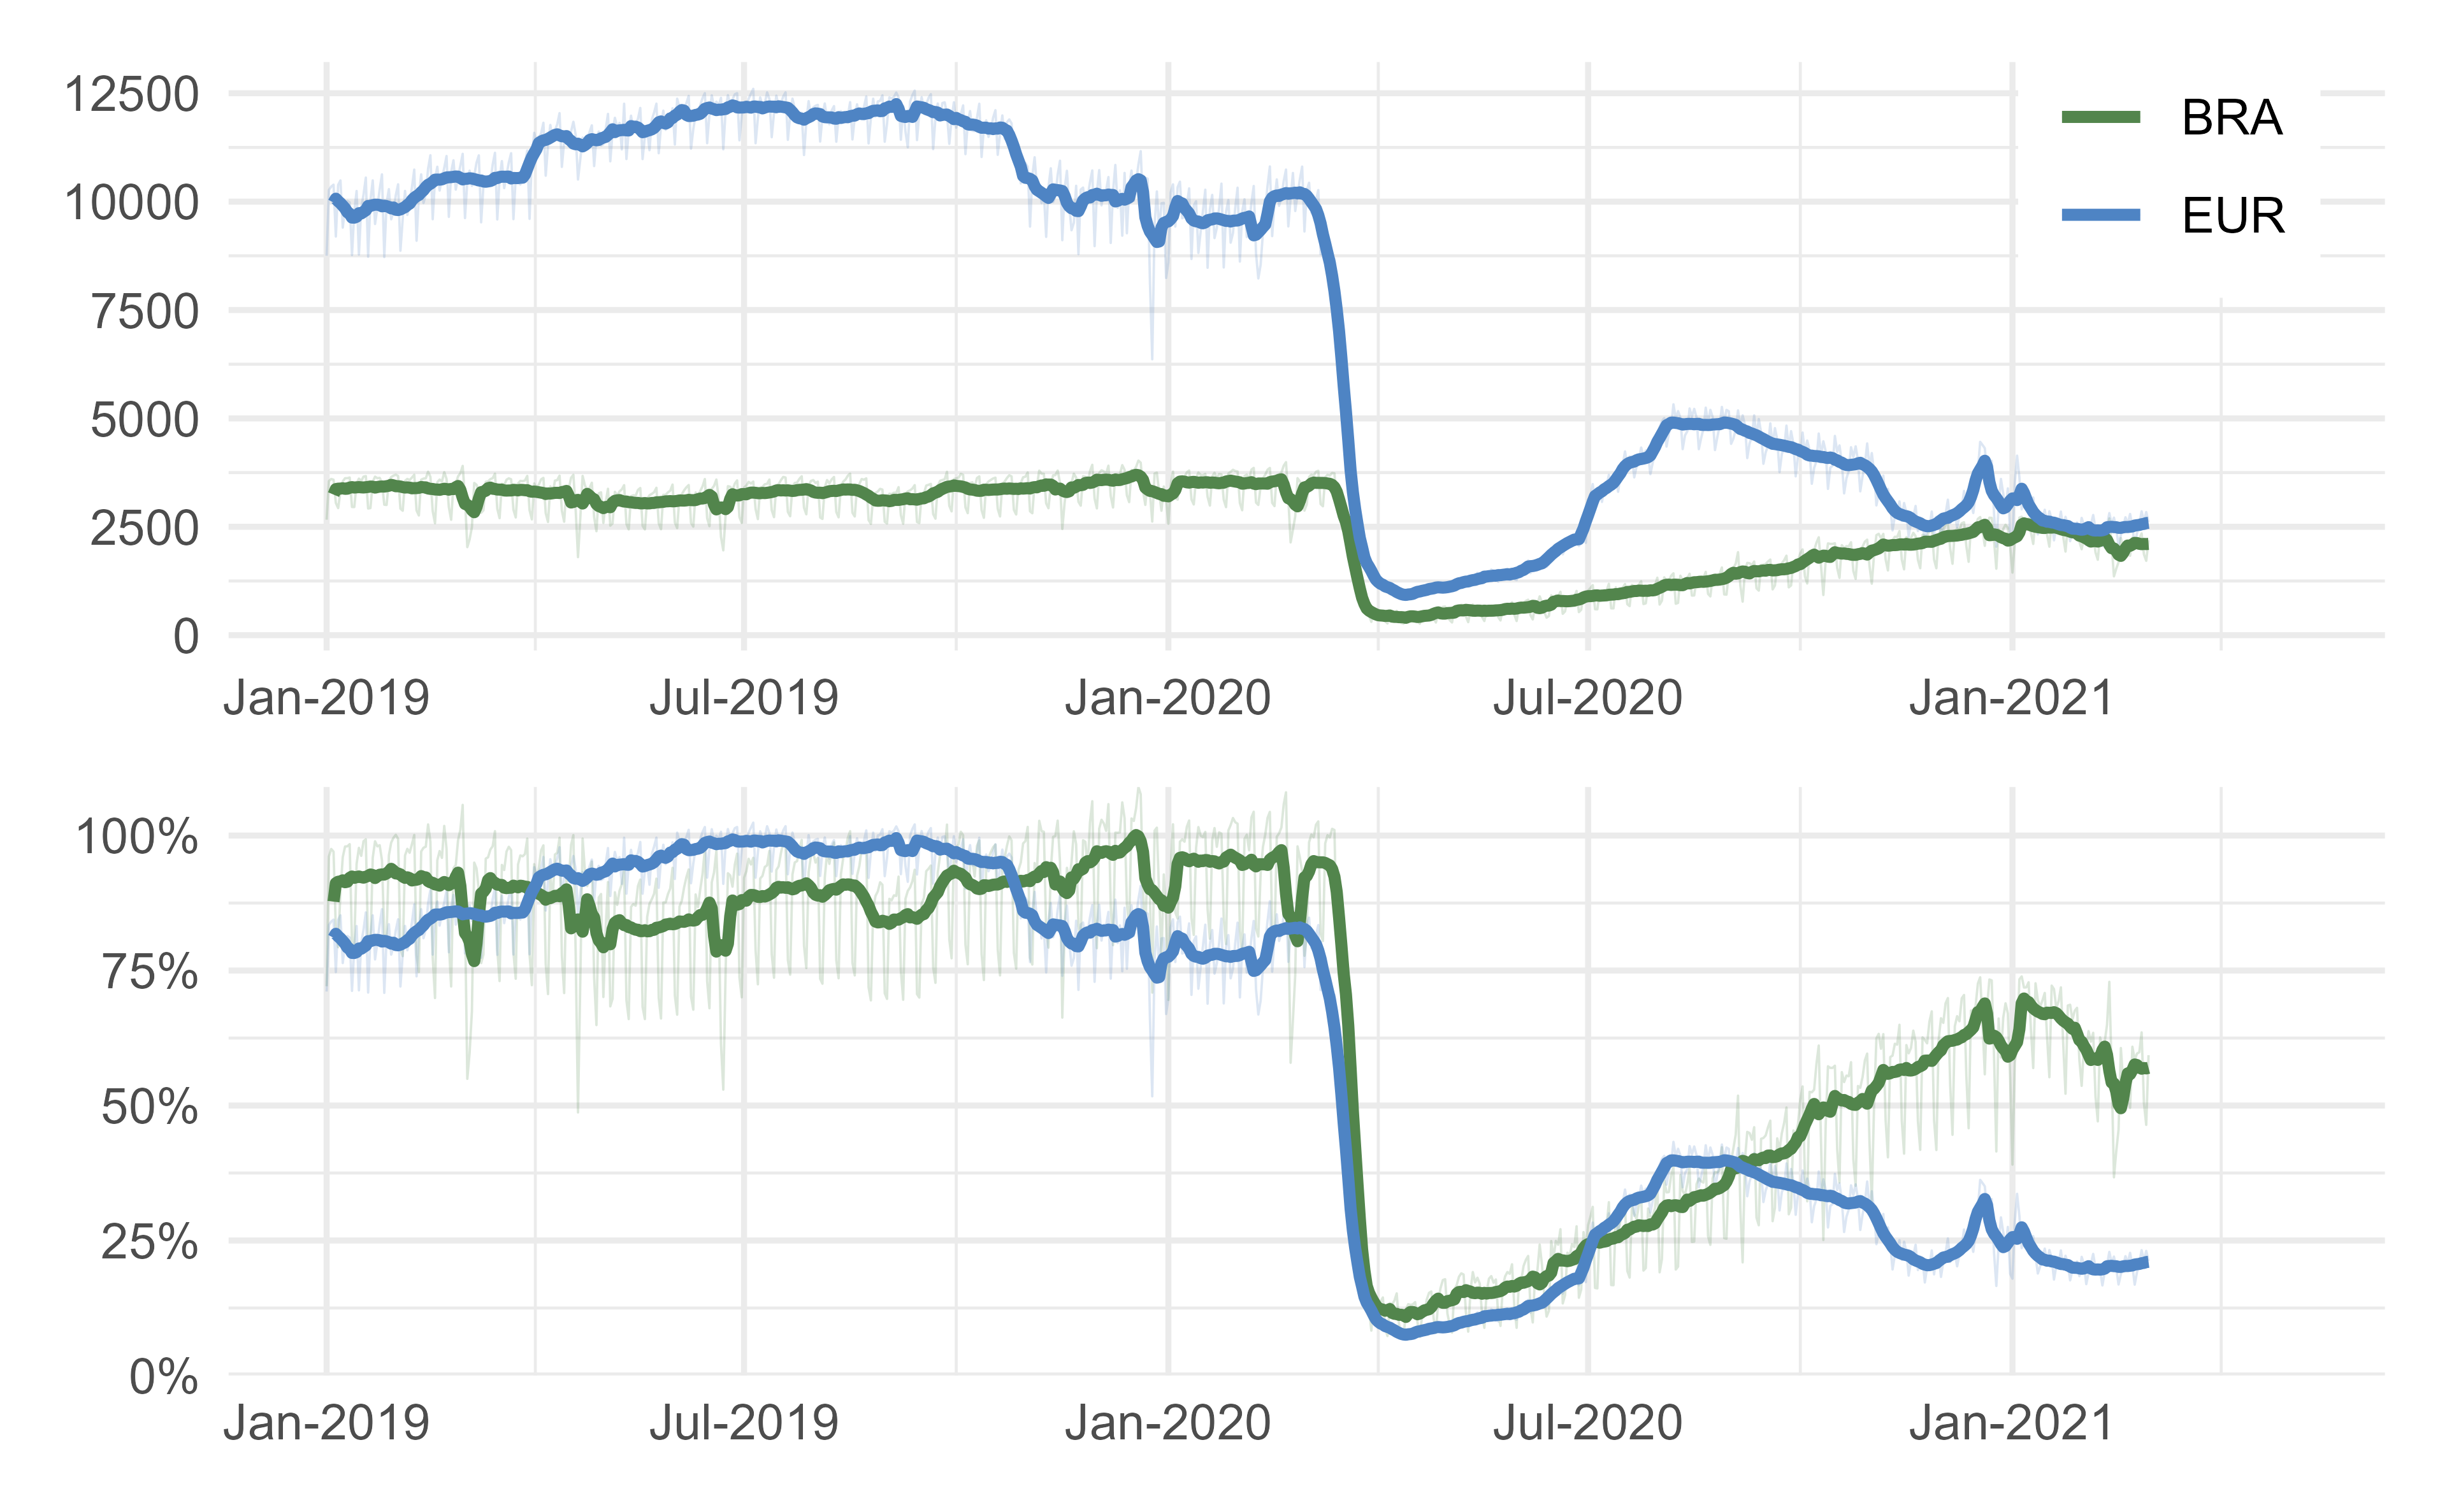
Figure 0.5: Daily Traffic at Top-10 Airports in Brazil and Europe (total and 7-day-average)
The normalised timeline in Figure 0.5 highlights a major difference between both regions. The top-10 airports in Europe represent major national hubs with a strong share of pan-regional and international traffic. With the initial shutdown of flights to Asia of major airline (e.g. KLM, British Airways, Air France, and Lufthansa) and the increasing national restrictions on air travel, the drop of air traffic appeared to start earlier in Europe. The share of airports with international traffic among the top-10 airports is smaller. The continual and steady recovery in 2020 benefitted from the higher share of national traffic. Viewing Brazil and Europe as regions, the wider variation and associated fragmentation of national response actions in terms of travel restrictions and lockdowns had a stronger effect on European traffic. The initial months of 2021 are also characterised by the on-going restrictions in Europe. Despite the fact that the study airports represent major hubs in different countries shows the impact of the highly restricted pan-regional traffic in Europe. As a single country - under a single policy - Brazil observed a higher level of recovery. The decline in the first quarter of 2021 is linked to the 2nd wave and associated traffic restrictions.
Impact on International Traffic at Top-10 Airports
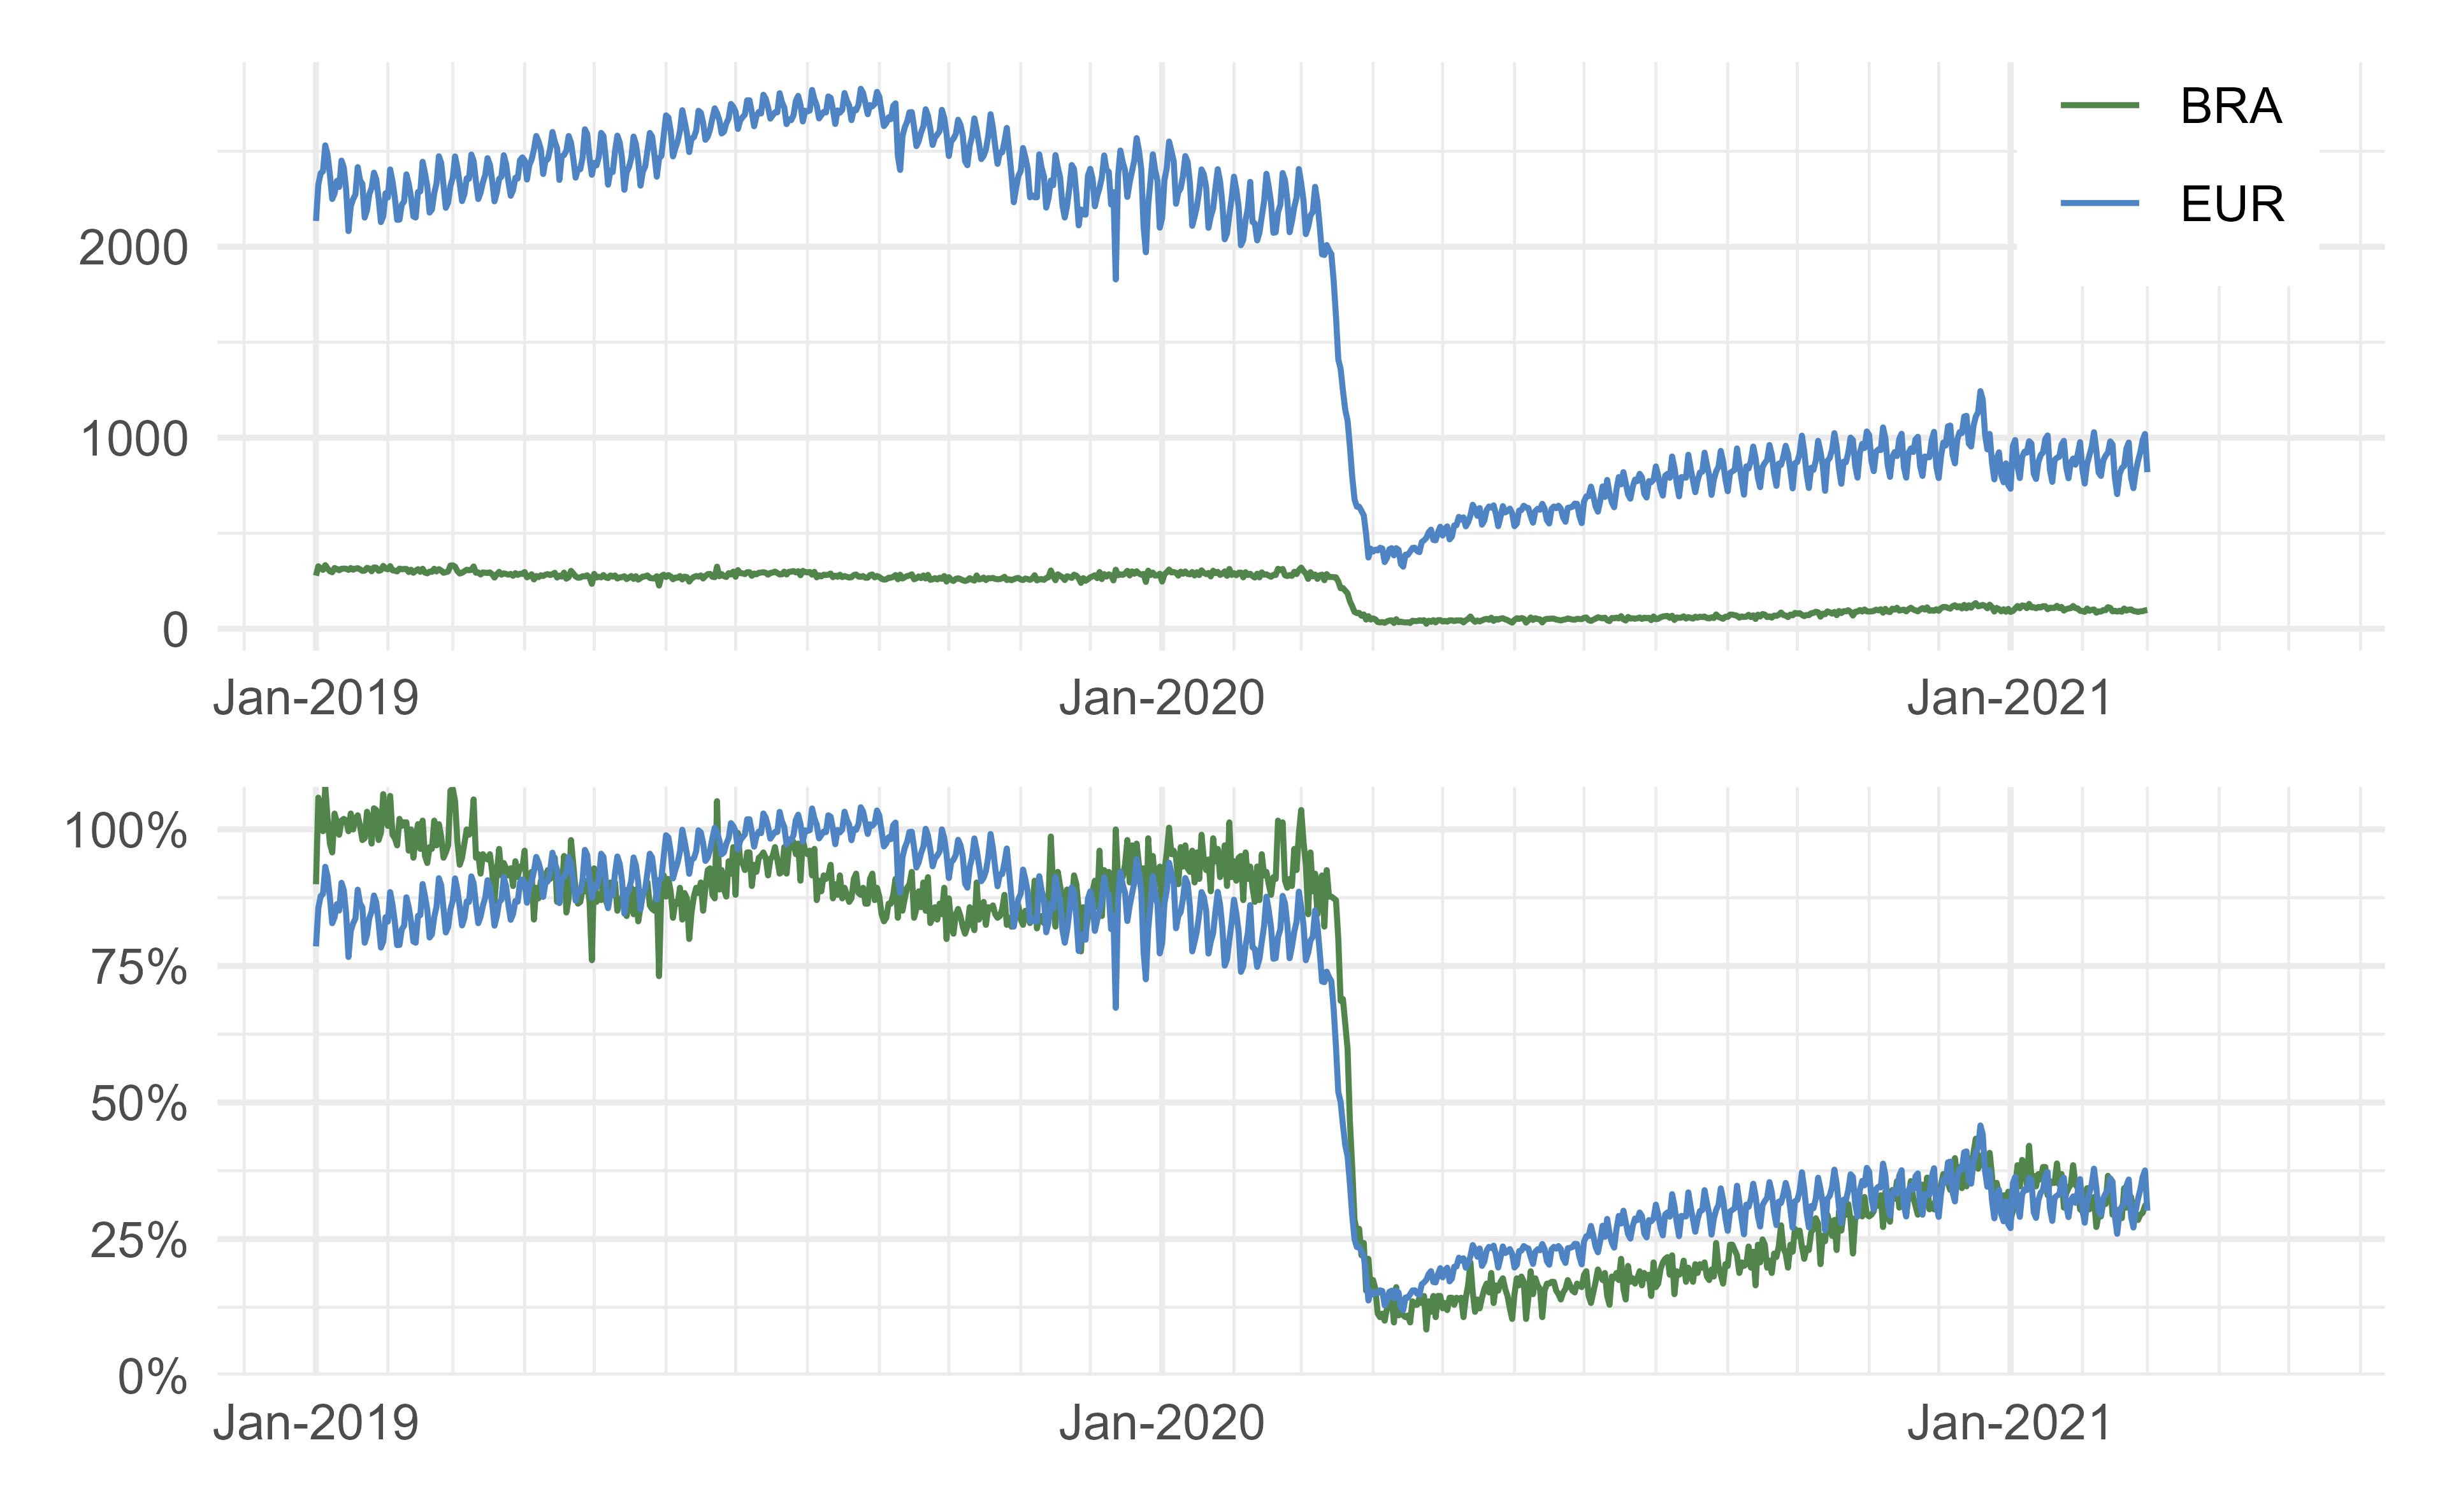
Figure 0.6: Evolution of international traffic (total and 7-day-average)
Figure 0.6 depicts the evolution of the international traffic at the top-10 airports in Brazil and Europe. In 2019 international traffic in Brazil ranges about 5-6 times lower than in Europe. The COVID related drop in international traffic occurred at the same time. This shows that both regions reacted similarly to the pandemic declaration of WHO on 11. March 2020 after the numbers of people affected outside China increased by a 13-fold. International traffic in Europe bounced to approximately 25% in the second half of 2020 and has plateaued at this level. In Brazil international traffic recovered slowly reaching a share of 25% compared to the 2019 refenrence level during the holiday season (Christmas 2020). In the first quarter of 2021 international traffic decreased as the increasing number of infections in Brazil discouraged travel.
Impact on Airport Level
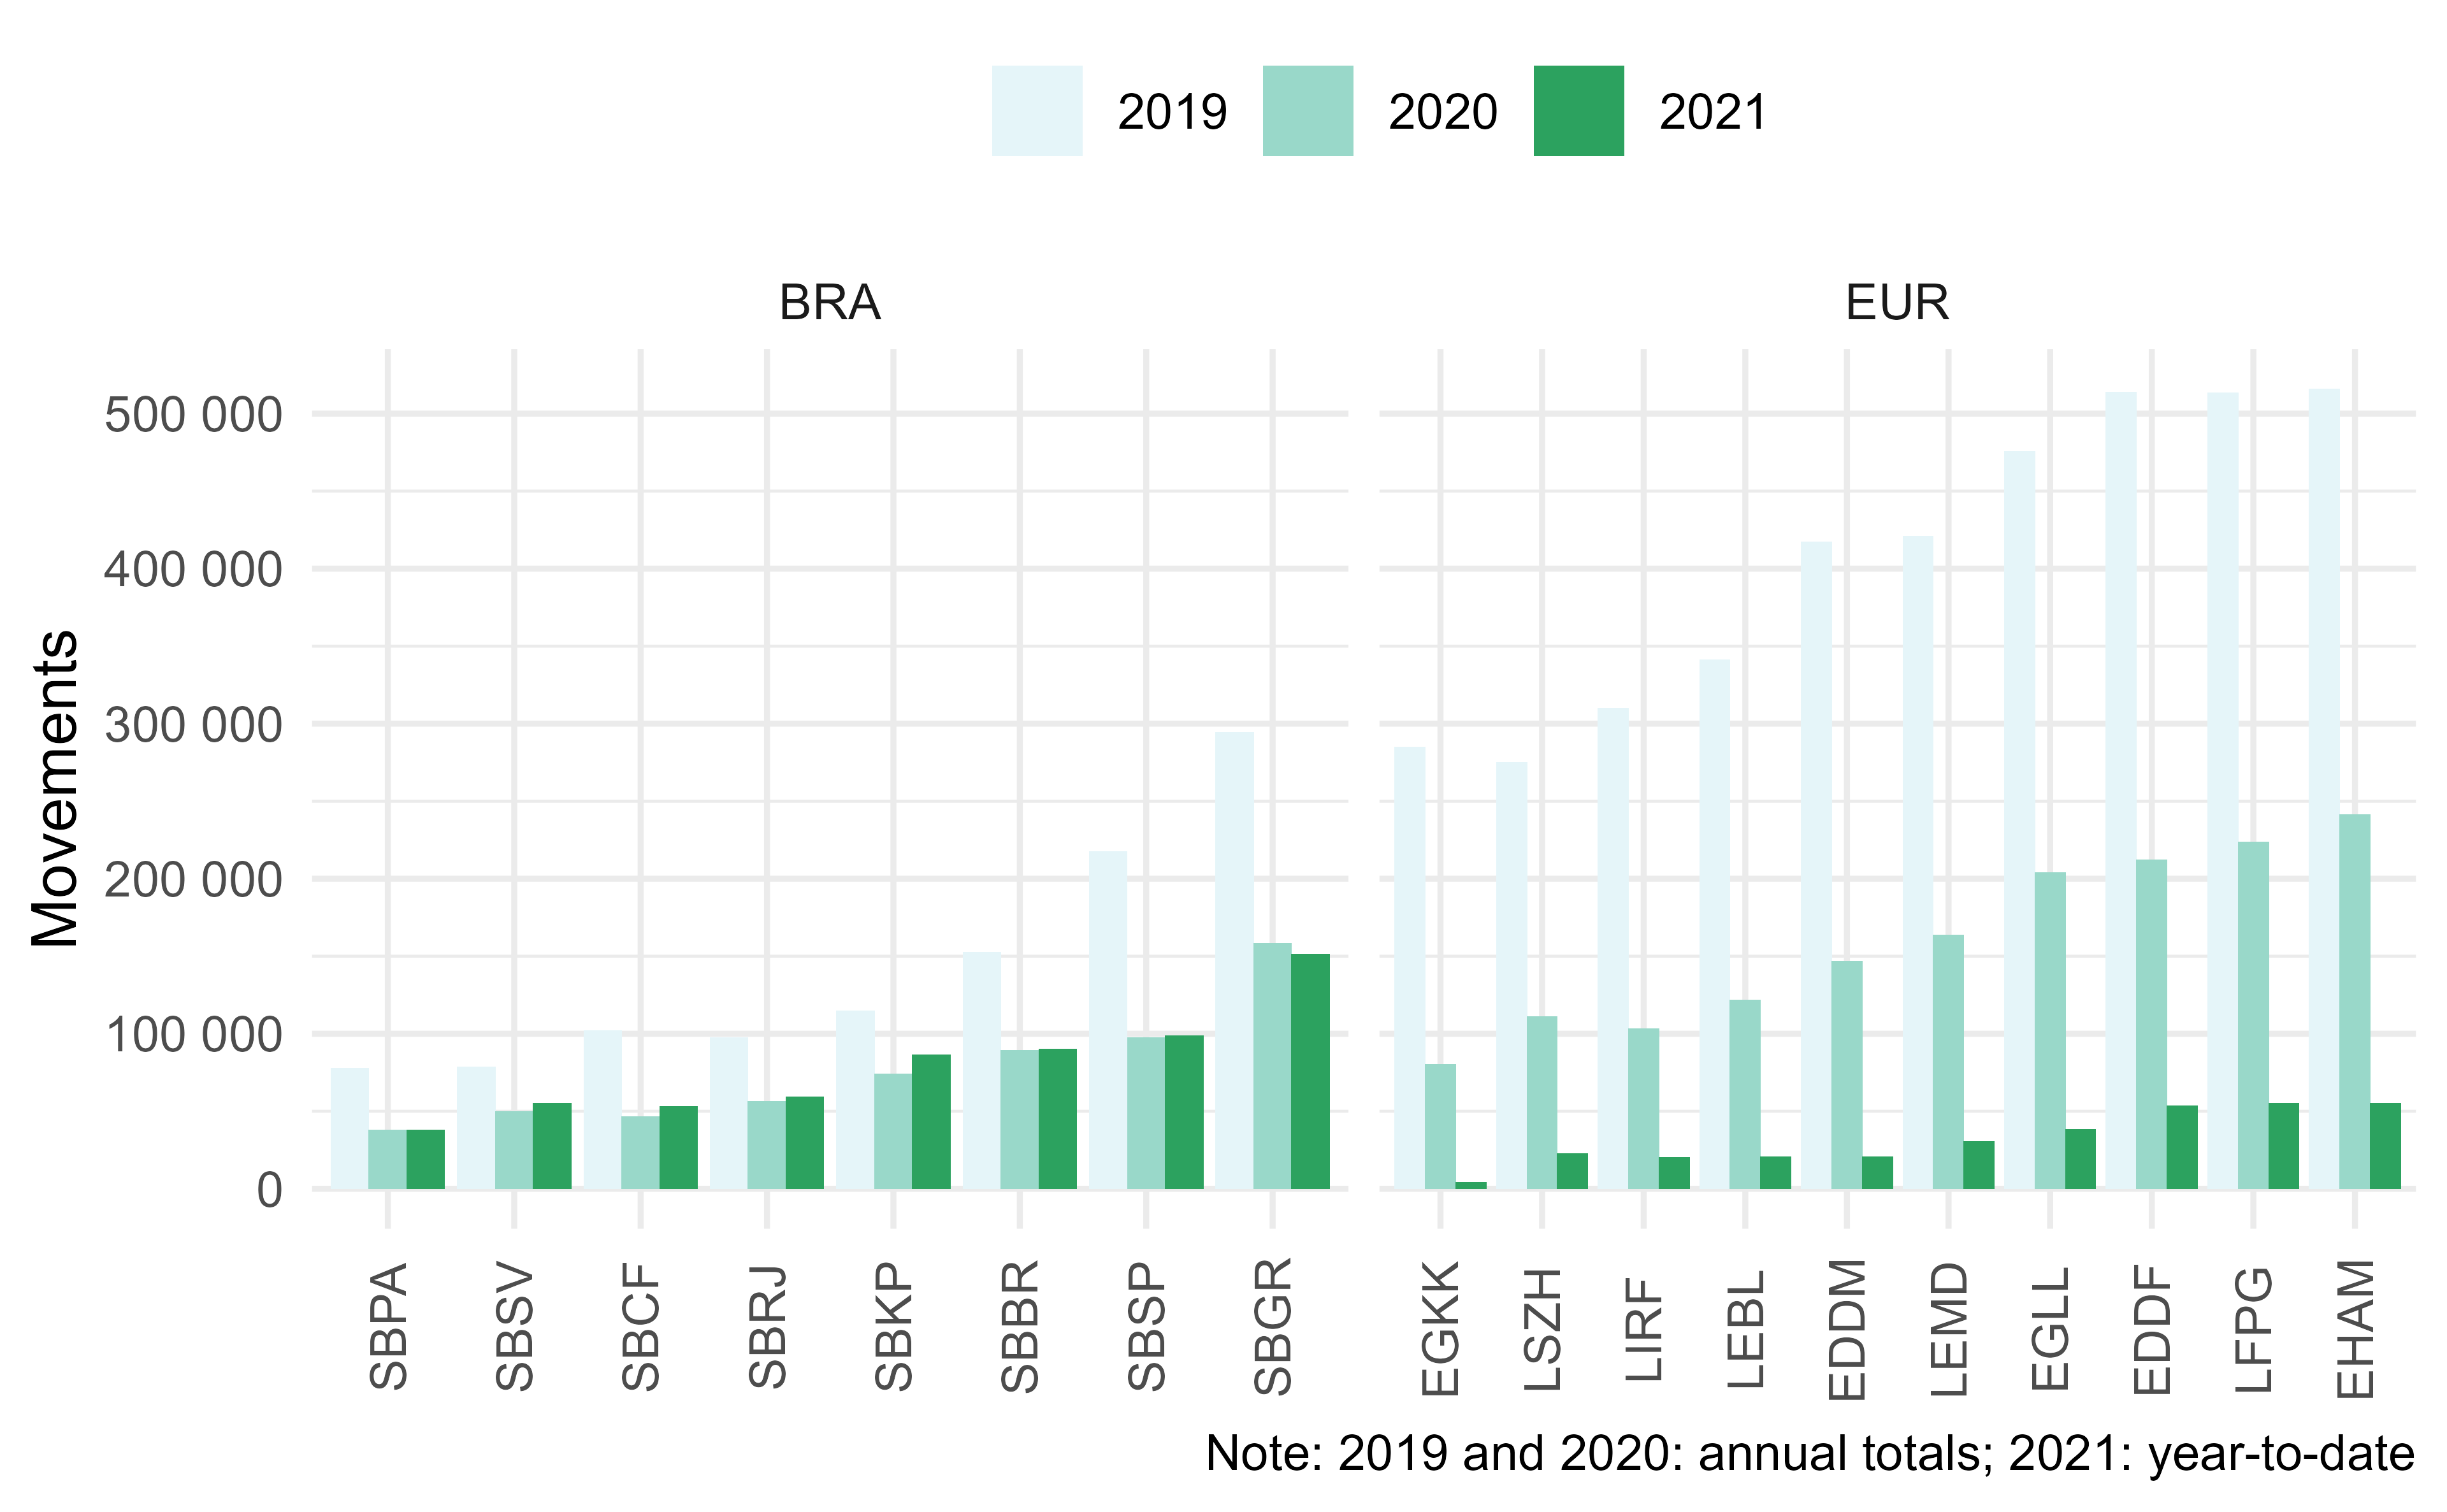
Figure 0.7: Movements at top-10 airports in Brazil and Europe
Figure 0.7 depicts the annual traffic for 2019 and 2020. The traffic for 2021 is shown on a year-to-date basis. While the overall traffic levels at the Brazilian top-10 is on average lower than the traffic at European airports, the aforementioned phenomena can now be identified on an airport-by-airport basis. In 2019, Guarulhos (SBGR) and São Paulo (SBSP) have shown traffic levels comparable with London Gatwick (EGKK), Zurich (LSZH), or Rome Fiumicino (LIRF). However, the annual traffic in 2020 exceeds in the case of SBGR and ranges at the same level for SBSP of the comparator airports in Europe. THis shows the effect of the drop in pan-regional traffic in Europe. On average, the annual traffic declined less in Brazil than at the European top-10. This difference in variation of the annual traffic has been already reported above, c.f. 0.4.
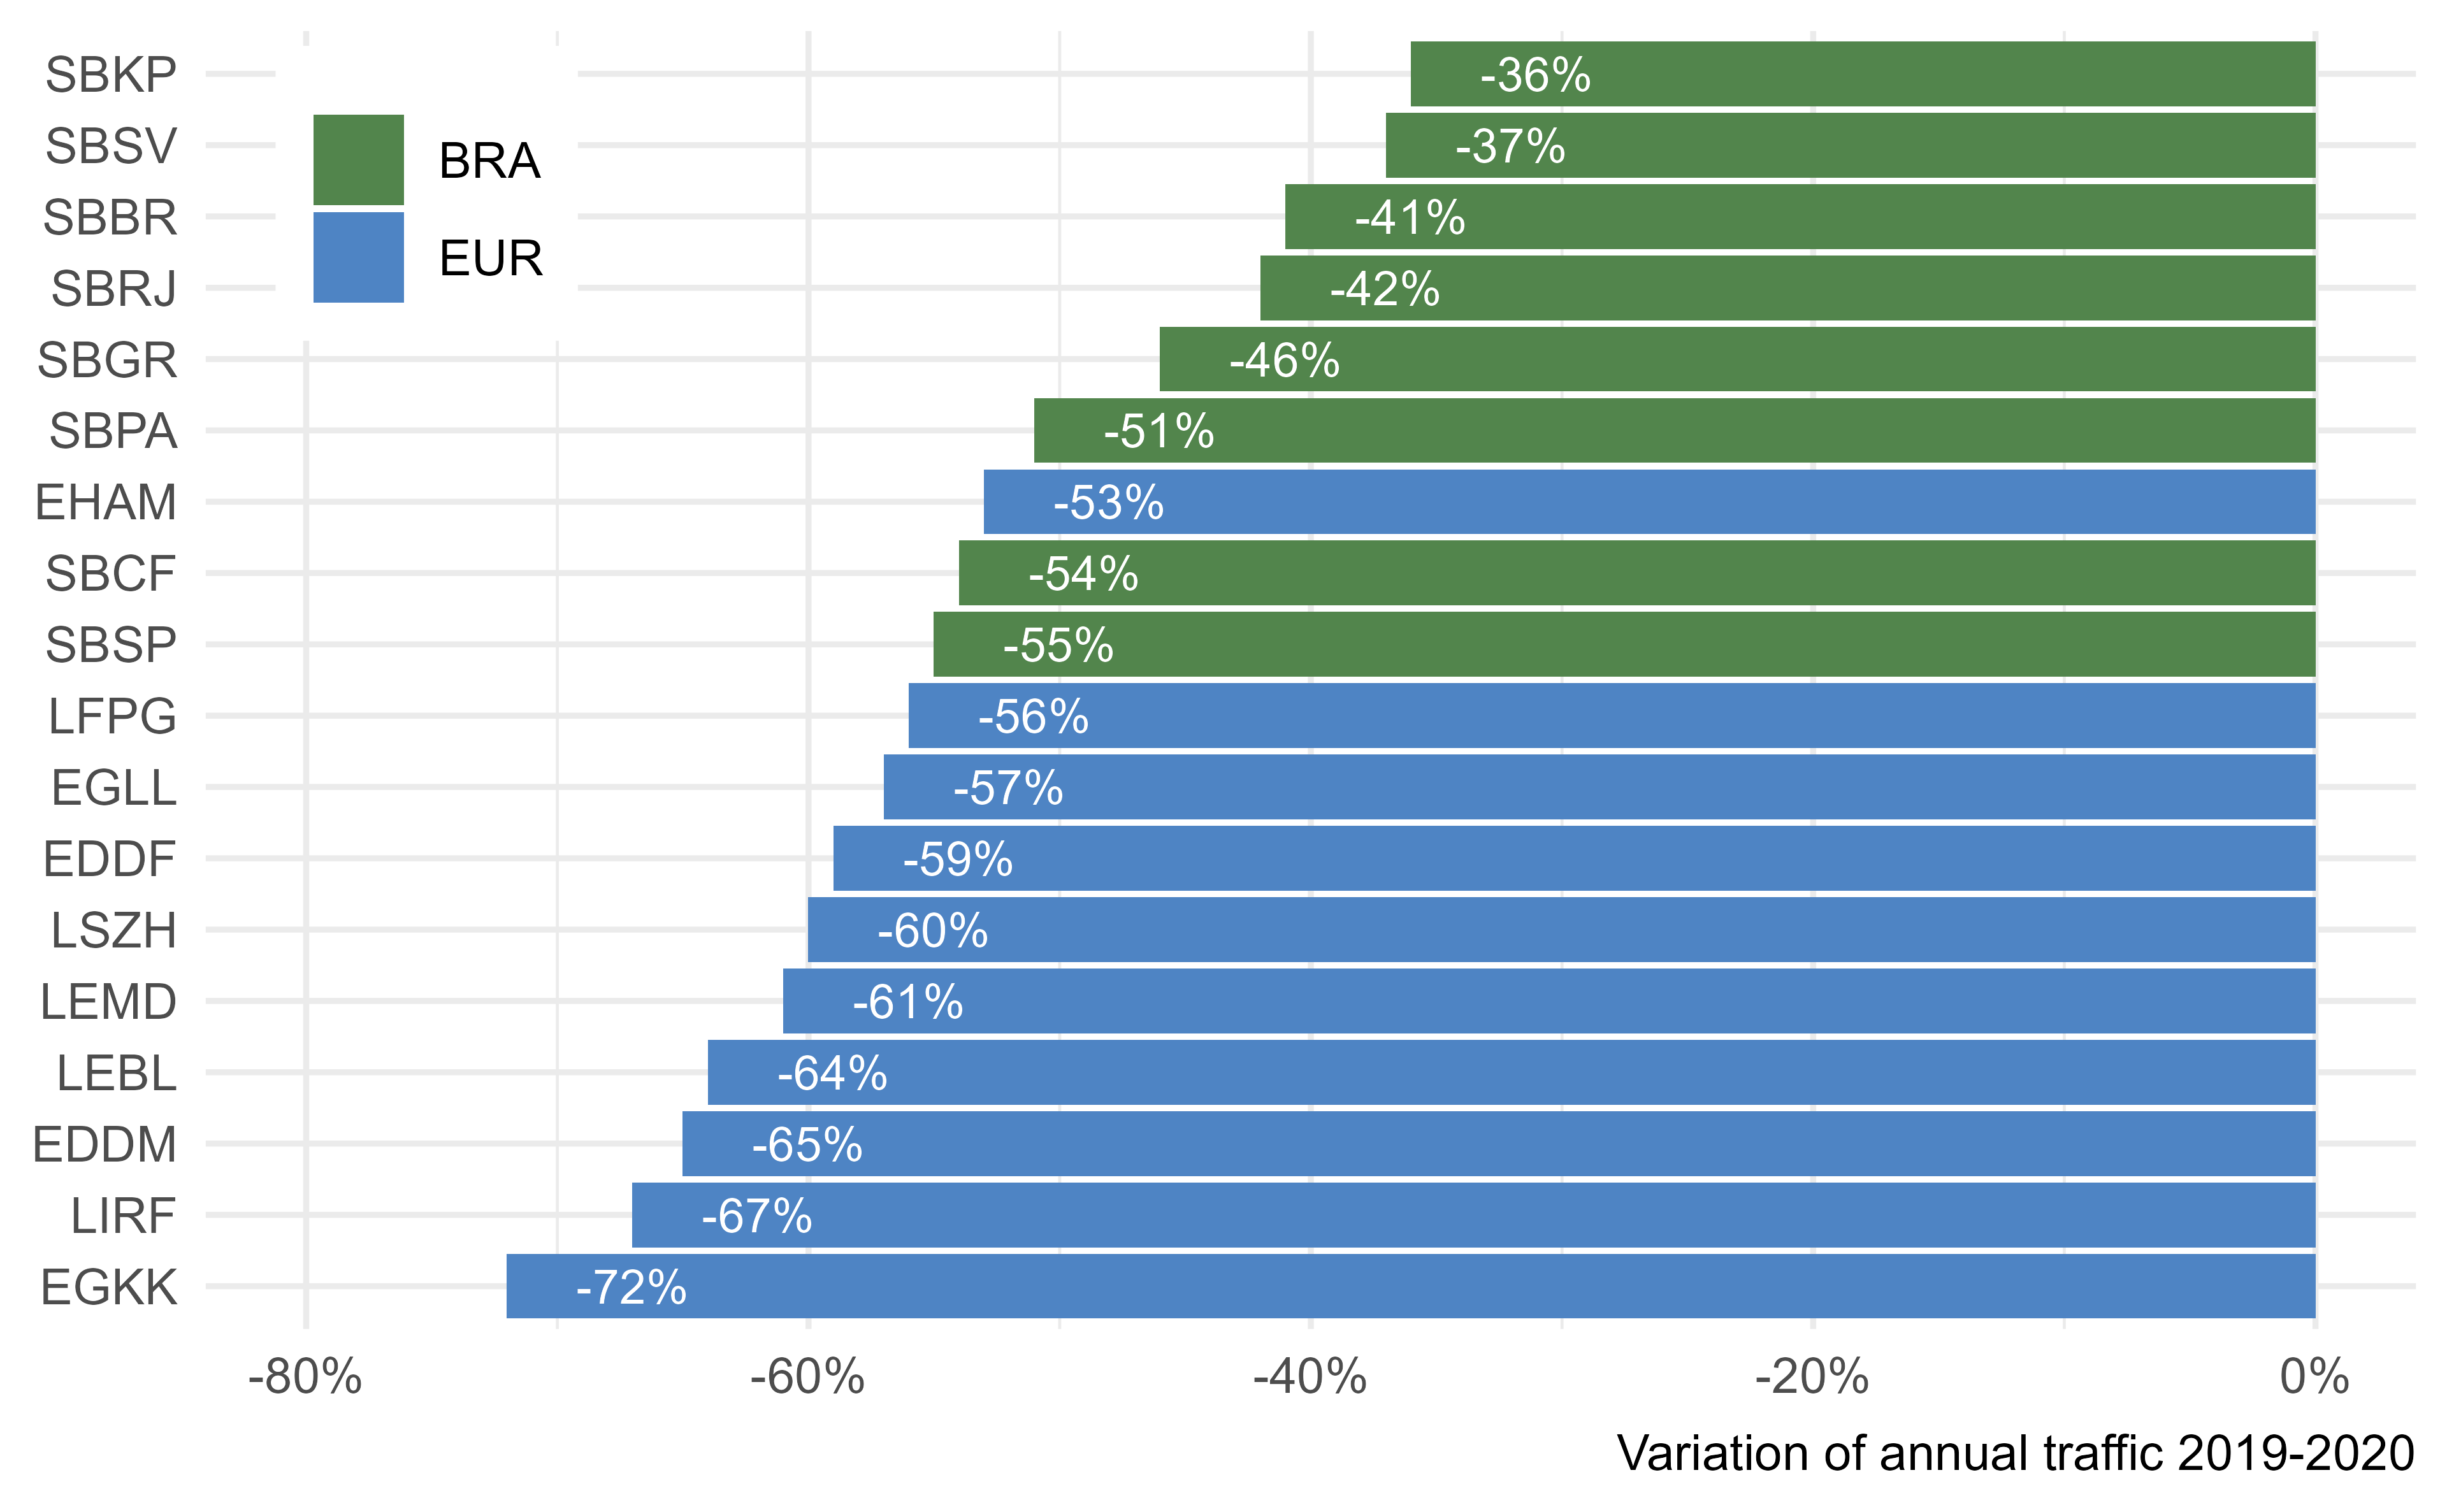
Figure 0.8: Annual variation of traffic at top-10 airports in Brazil and Europe
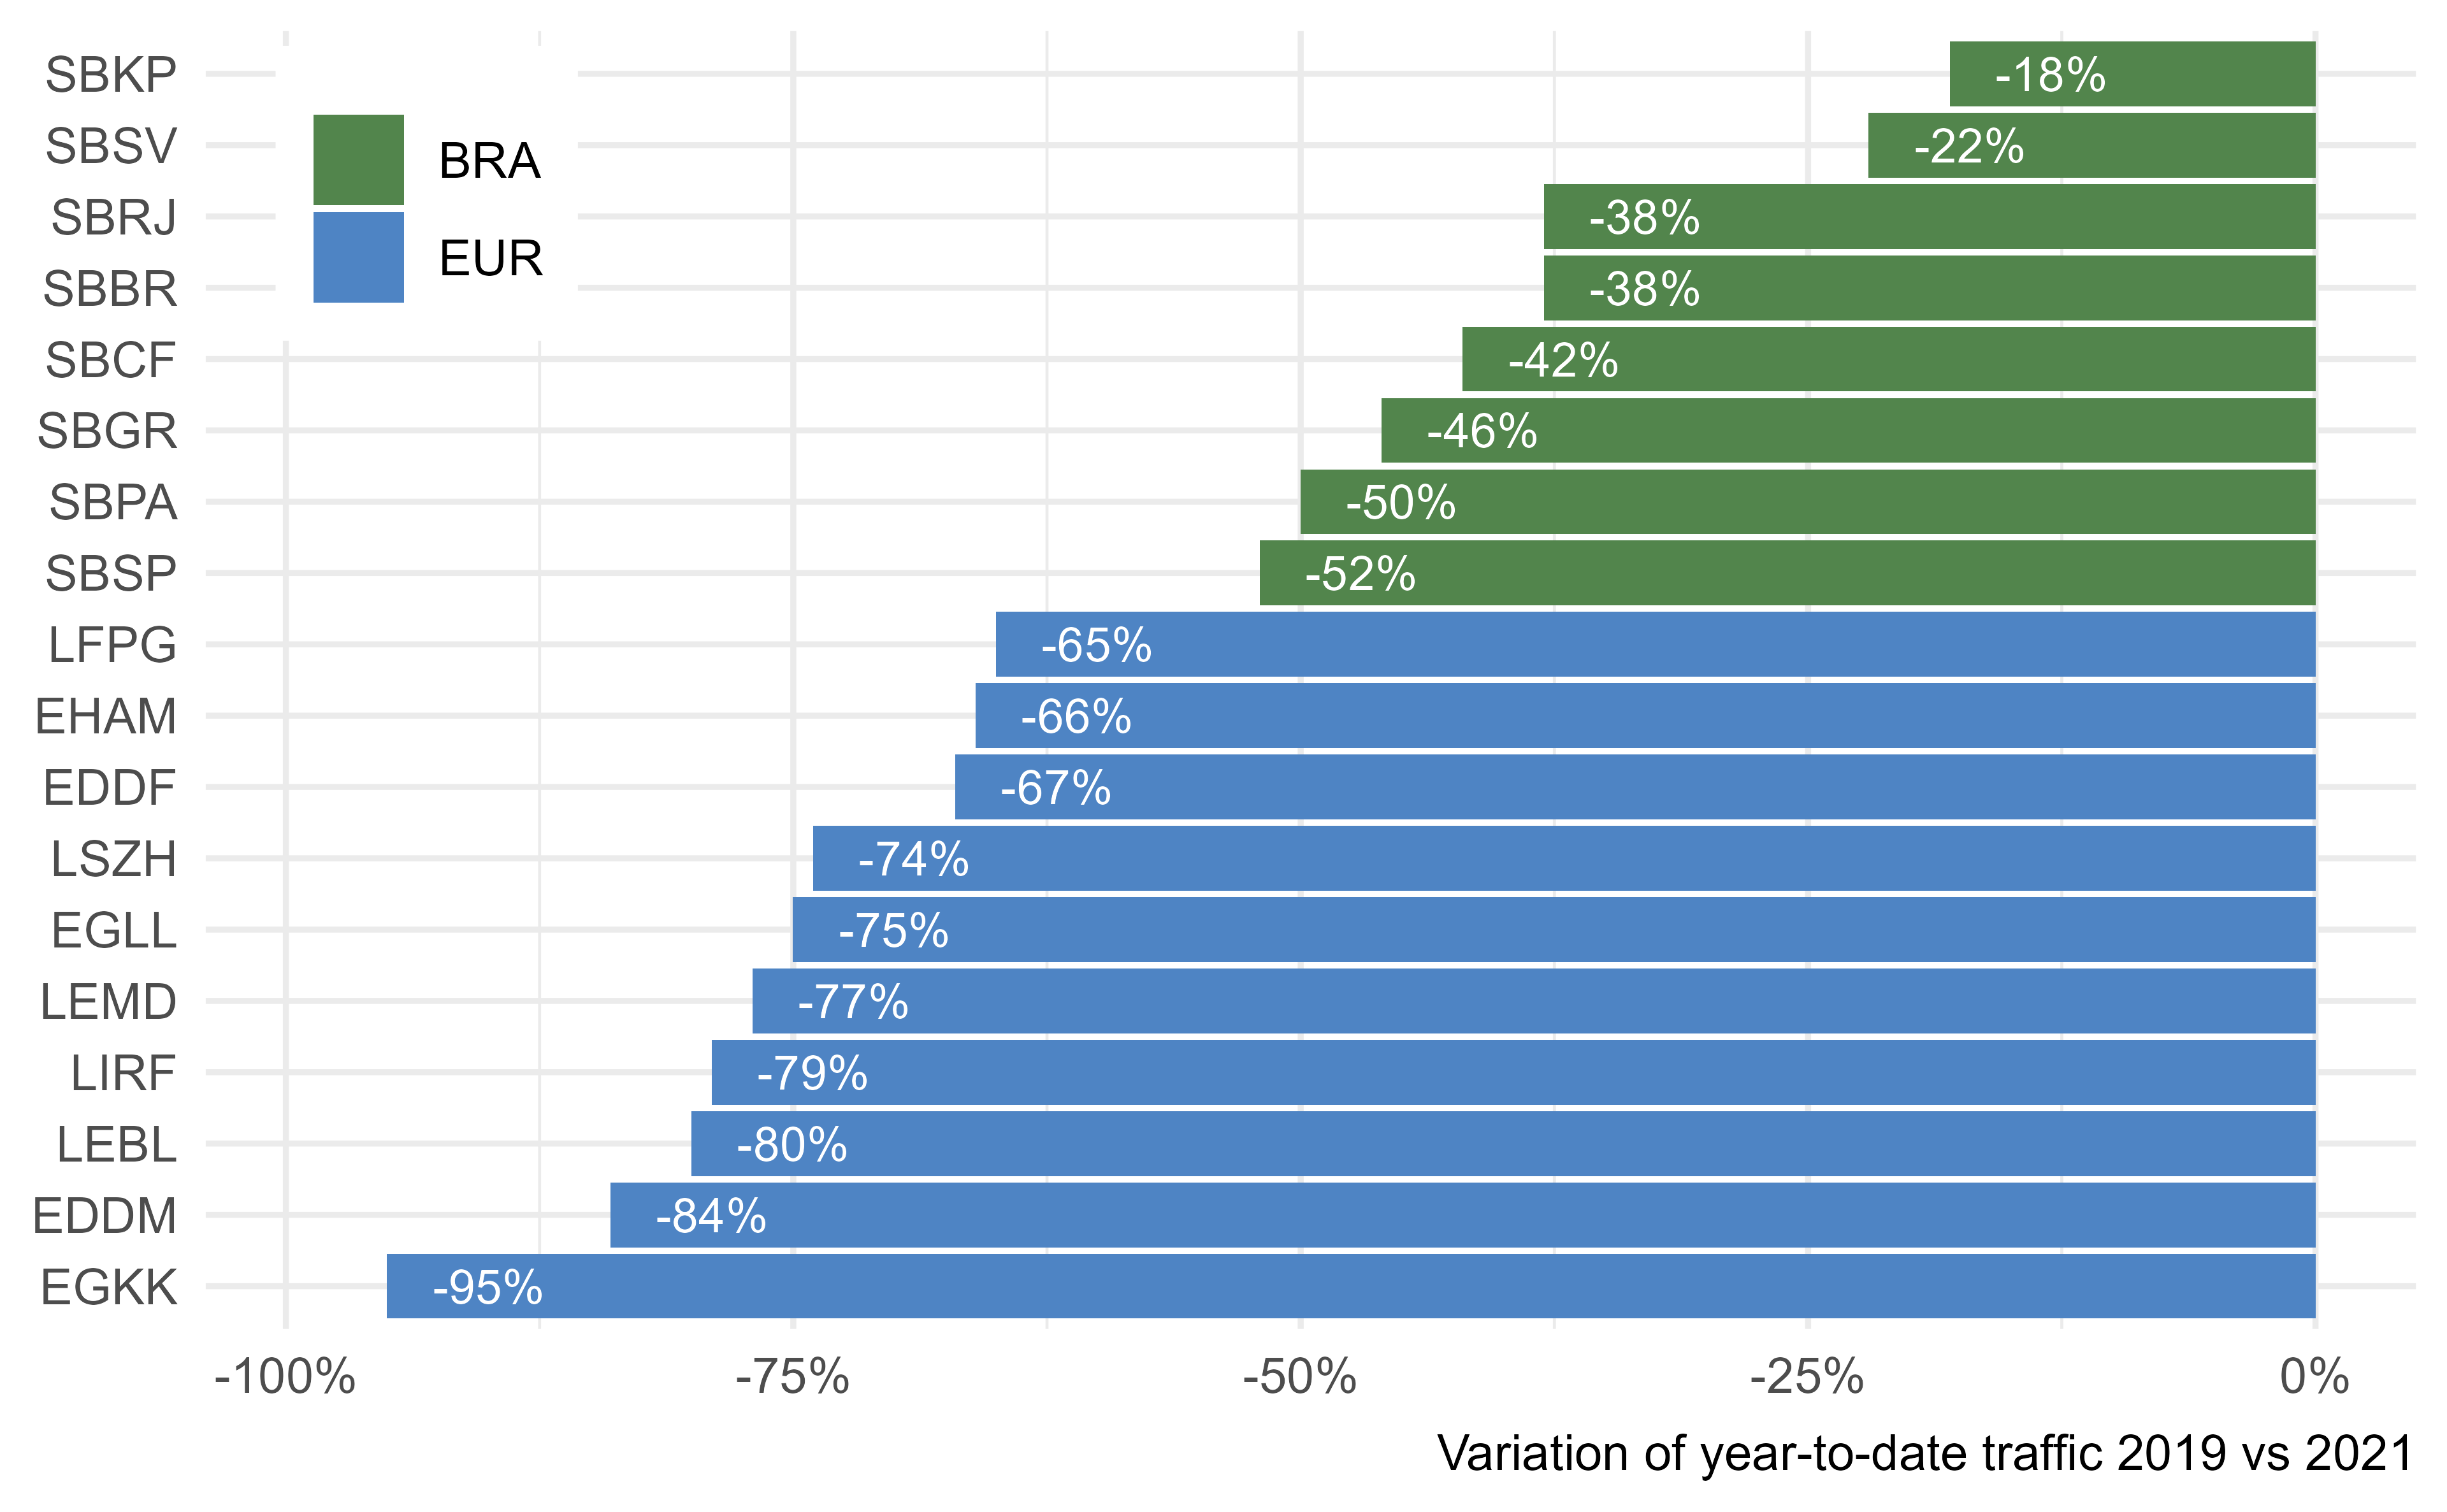
Figure 0.9: Year-to-date variation of traffic at top-10 airports in Brazil and Europe
Figure 0.8 shows the variation of the annual traffic at the top-10 airports in each region. The ordering shows that on average European airports have seen a higher share of air traffic reduction than the top-10 in Brazil. The beginning of 2021, c.f. 0.9, shows a higher level of traffic recovery at the top-10 airports in Brazil. This recovery needs to be balanced across the overall trend showing a new wave decline, c.f. 0.5. With a discernible recovery in Europe the dire overall year-to-date results are expected to improve.
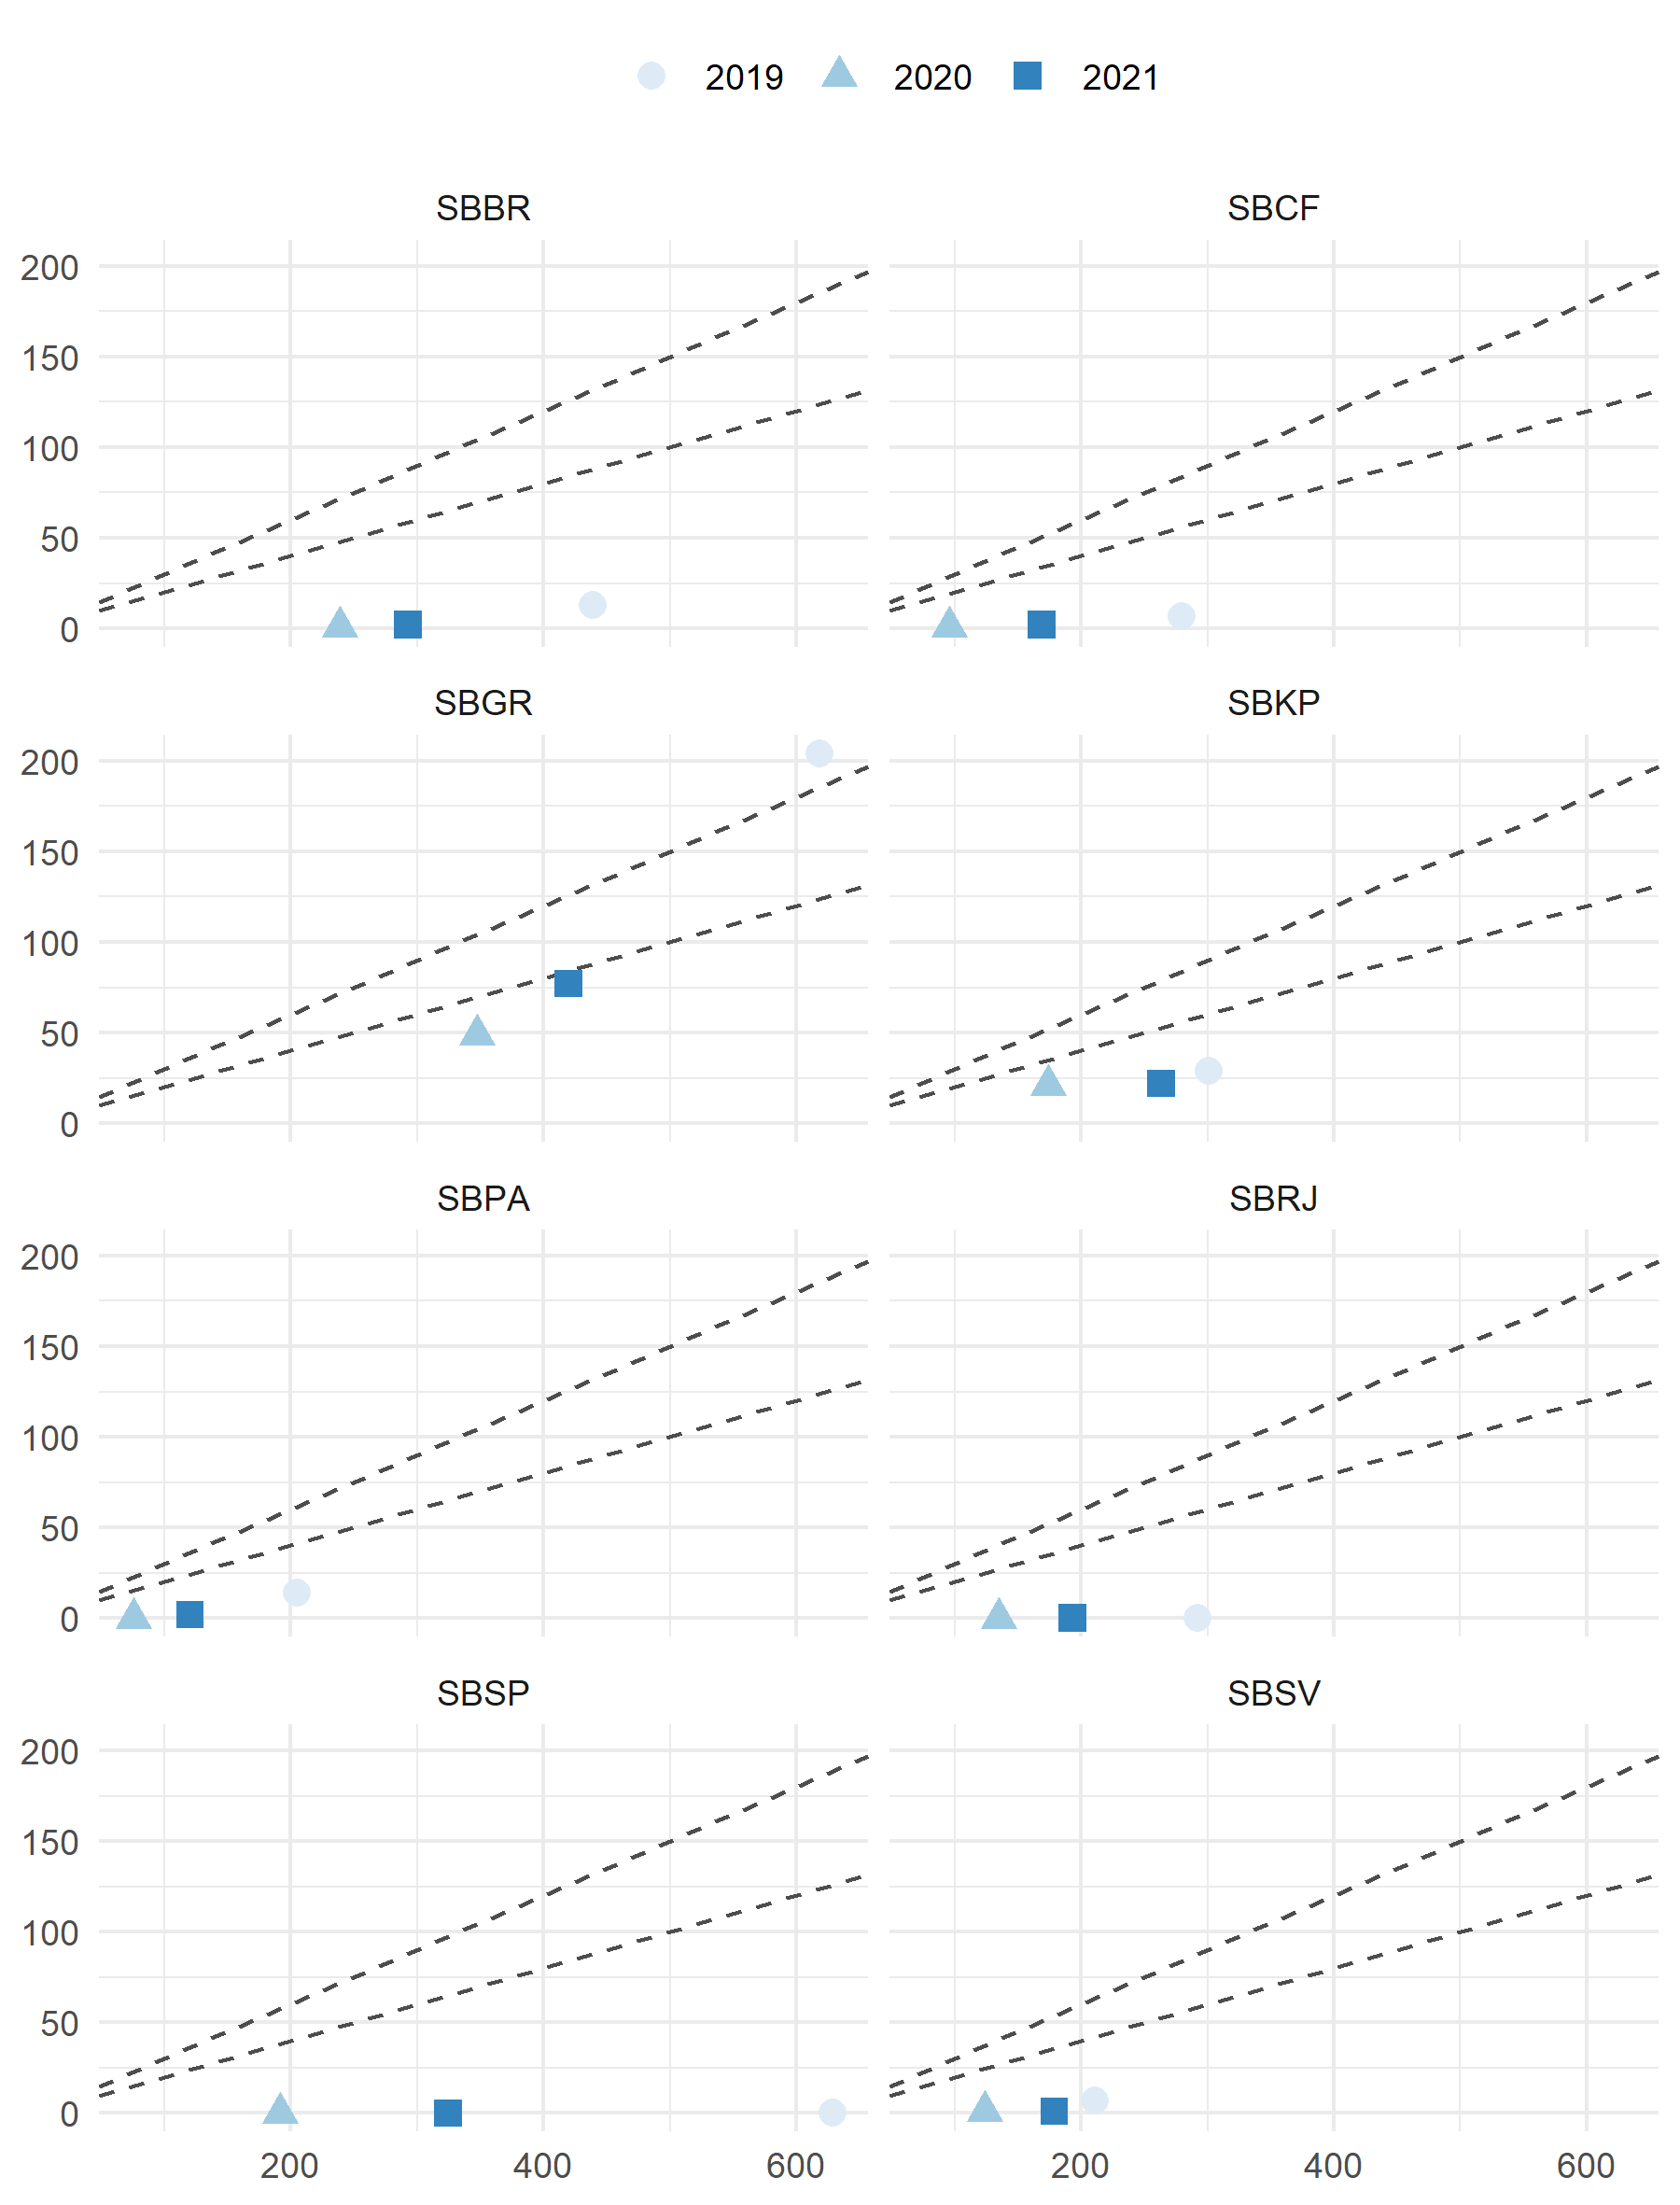
Figure 0.10: Brazil - share of international over domestic traffic
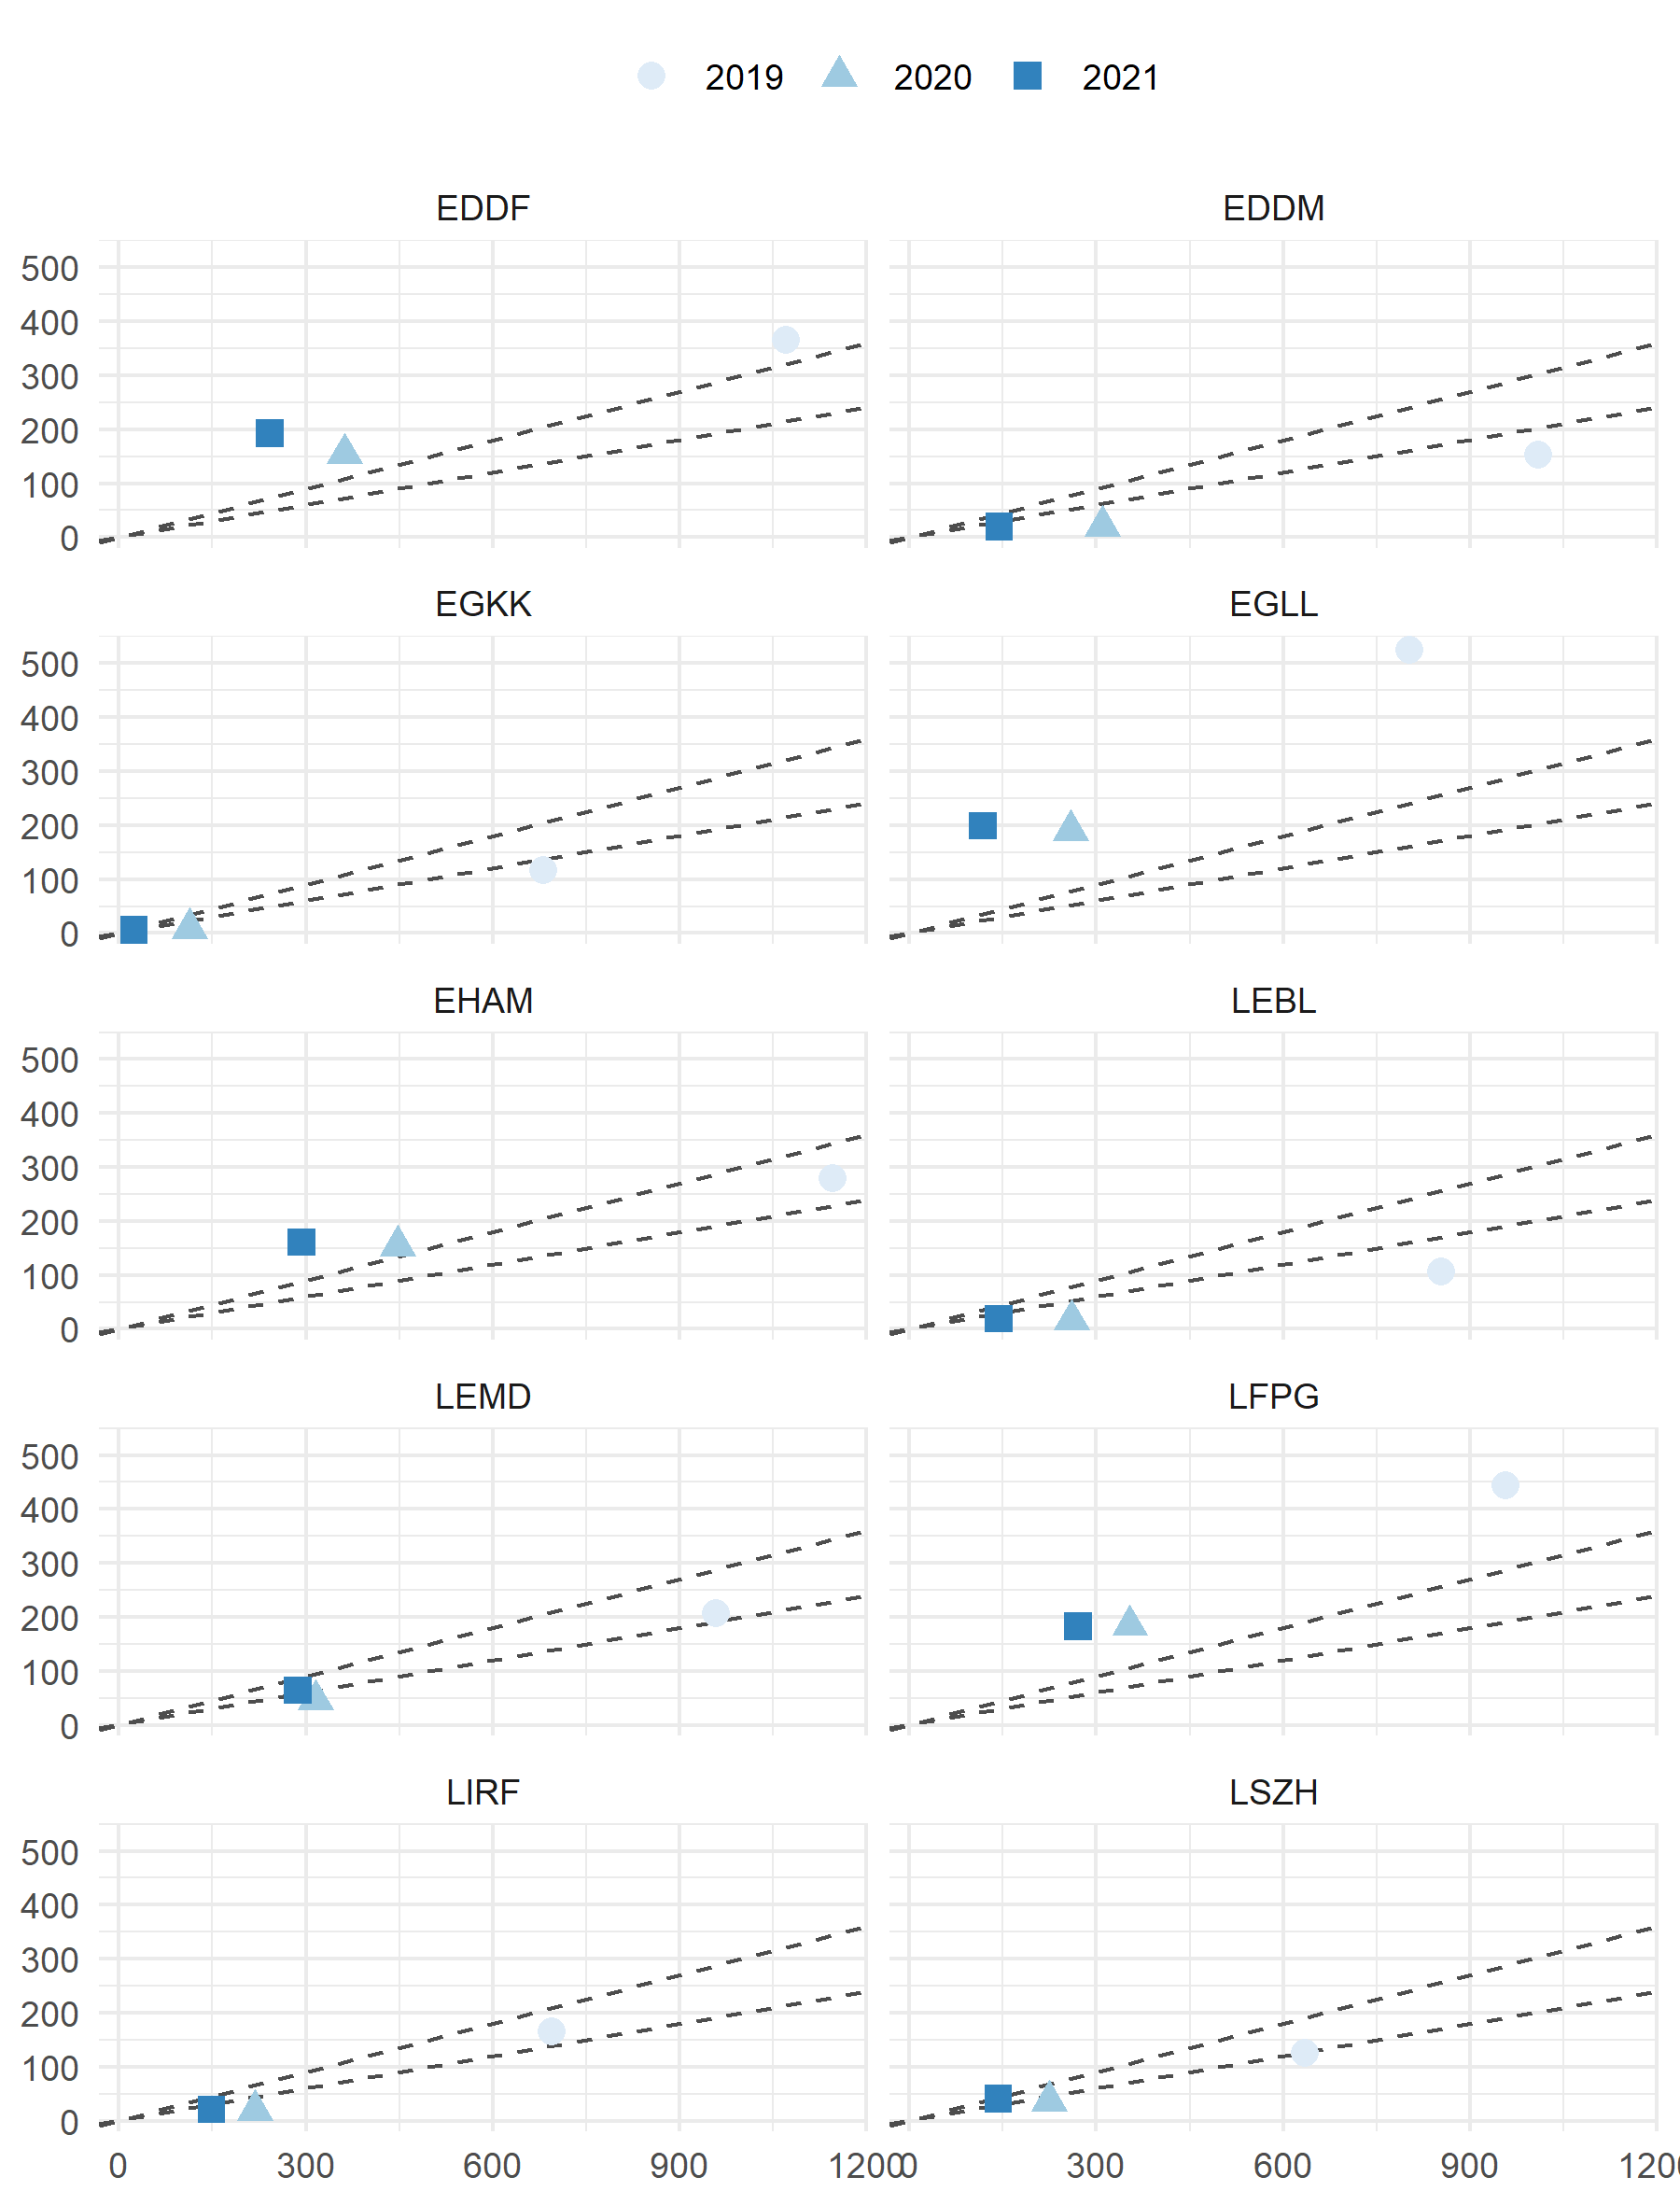
Figure 0.11: Europe - share of international over domestic traffic
Figure 0.10 and Fig. 0.11 show the relationship between the annual median number of international over domestic flights for the top-10 airport in both regions. The observed traffic at all airports shows the contracting behaviour when comparing the share of international and regional flights. As presented above, the majority of Brazilian airports in this study serve predominantly regional (domestic) traffic. SBGL and SBGR are the 2 airports of the Brazilian top-10 that observe a share of international traffic ranging around 30% with a clear contraction when comparing 2019 with 2020 and 2021. The role of SBSP as a national hub and negligible international traffic is prominent.The other airports sit below the 20% composition. For Amsterdam (EHAM), Frankfurt (EDDF), and London Heathrow (EGLL) the ratio of international vs regional (domestic and pan-European) flights ranges in all years above the 30%. The nature of the European network is shown in Fig. 0.11. The majority of the European top-10 airports observe a share of international flights ranging between 20-30% of the total traffic. The overall traffic decline in 2020 and in the beginning of 2021 can be seen in the contraction towards the origin with a typical higher loss of international traffic. On average, European airports serve a higher number of international traffic. This is linked to the wide-spread market of national hubs and flag carriers. This also shows that Europe is more susceptible to international and regional travel contraints. The high share of international (non-European traffic) at London Heathrow (EGLL), Amsterdam (EHAM), and frankfurt (EDDF) evidences further what role these major hubs play within the European network.