Chapter 6 Efficiency
Operational efficiency is a critical component in assessing the management and execution of operations. It provides insights in the management of arrival and departure flows and the associated separation and synchronisation activities. Inefficiencies can have an impact on user operations in terms of experiencing delays or excessive fuel burn. The measures reported in this study are based on the observed travel time during surface operations (i.e. taxi-in and taxi-out) and during the arrival phase. These travel times are compared with an associated reference time. The determined difference (i.e. additional times) measures the level of inefficiencies. It must be noted that high performance operations will still yield a certain share of measured additional times. Operational efficiency is therefore aiming at the minimisation of these additional times as they cannot be zero.
6.1 Additional Taxi-In Time
The additional taxi-in time measures the travel time of an arriving flight from its touchdown (i.e. actual landing time [ALDT]) to its stand/gate position (i.e. actual in-block time [AIBT]). The travel time is compared to a reference time. The reference time is determined for flights arriving at the same runway and/or the same stand/gate position. The additional taxi-in time provides a pointer on the management of the inbound surface traffic.
Due to data availability (i.e. no stand/gate information), the reference times for the Brazilian airports have been computed on the airport level. It needs to be noted that such an aggregation on the airport level may be influenced by the predominant runway configuration and frequently used stand/parking positions. This phenomenon merits further study in one of the future editions.
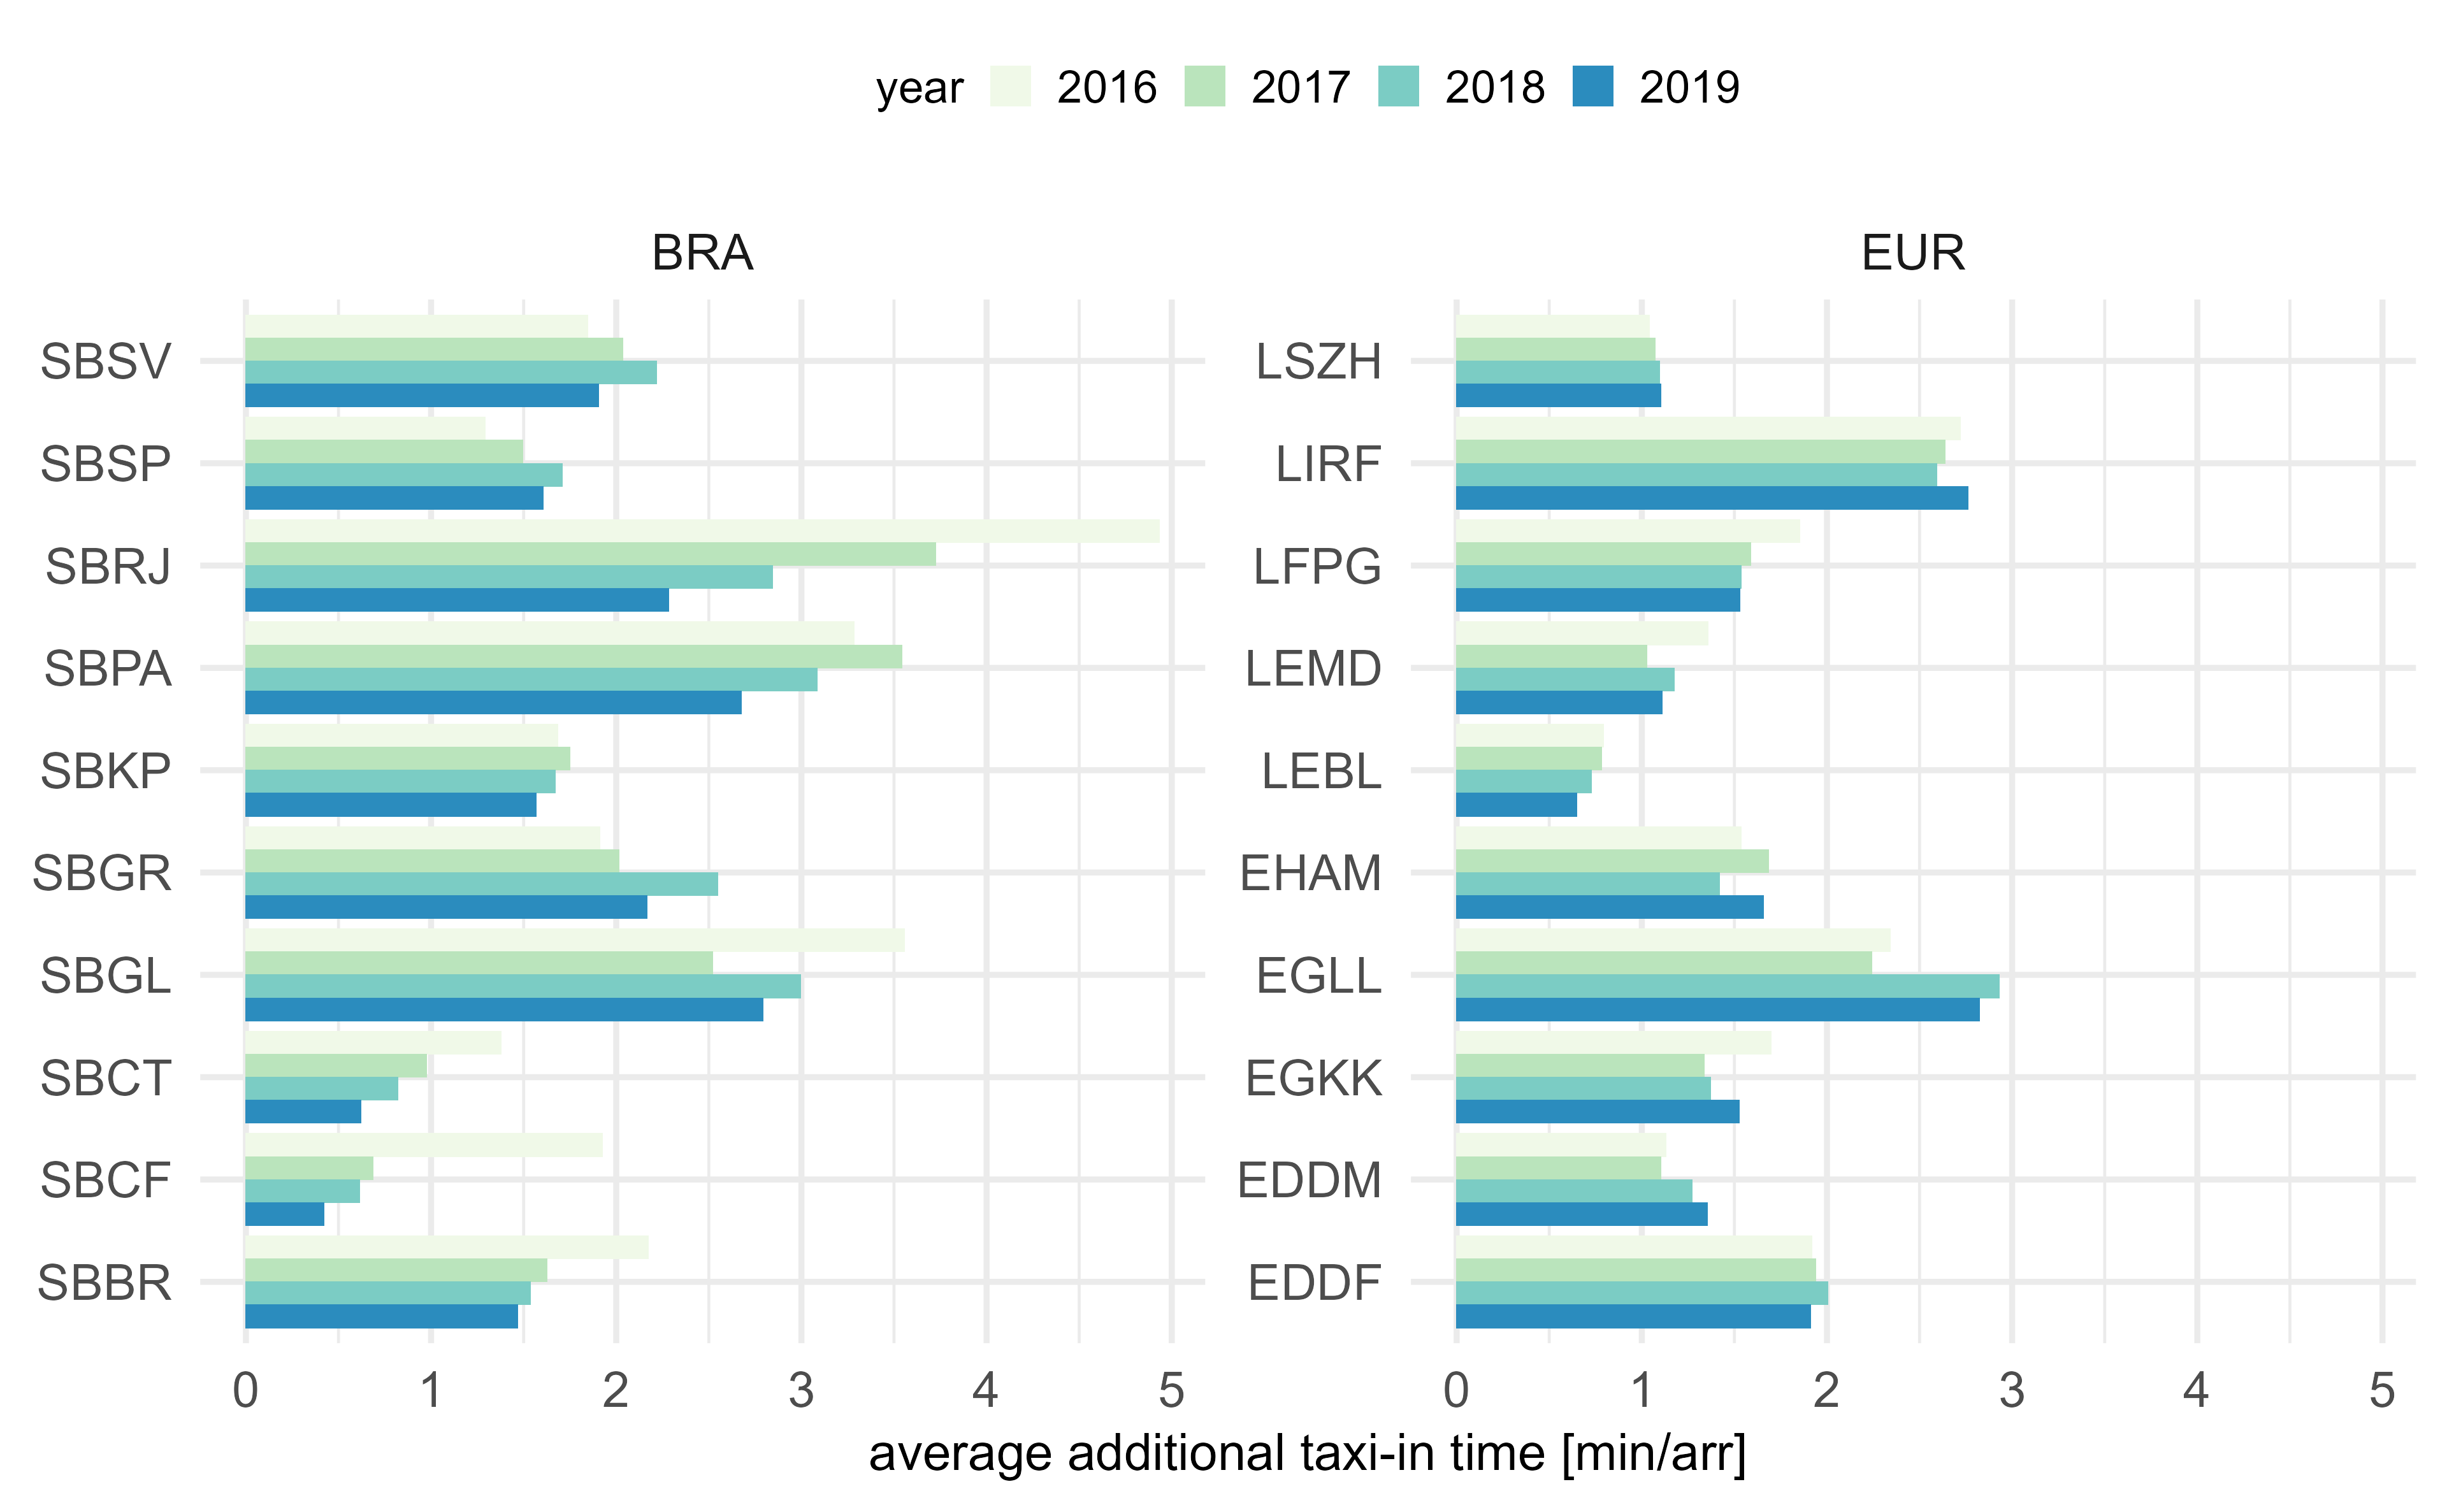
Figure 6.1 shows the variation of the observed additional taxi-in times.

Figure 6.1: Additional taxi-in time
For the majority of Brazilian airports, the average additional taxi-in time ranges at or below 2 minutes per arrival. For all airports an improvement in terms of reduction of the additional taxi-in time was observed across the time horizon of this report. Galeão (SBGL), Porto Alegre (SBPA), and Santos Dumont (SBRJ), with an additional taxi-in time ranging around 3 minutes per arrival, exhibited the highest observed taxi-in times.
Factors that may have contributed to the reduction in additional taxi-in time over the years include:
- Demand reduction after the economic crisis in 2015;
- Improved tower and ground control performance as a consequence of investments and operational changes made following the increased traffic demand observed during the 2014 Soccer World Cup;
- Infrastructure improvements due to works for major events such as Confederations Cup, Soccer World Cup and Olympics. Many of these works were only completed in the years following the events;
- Efficiency gains over time after airport privatisation (granted to the private sector); and
- Efforts of the Brazilian aviation community in implementing study groups for operational developments such as AGILE GRU, AGILE RIO, AGILE CAMPINAS and GEPEA (Airspace Planning Study Group).
The majority of European airports showed a fairly stable average additional taxi-in time for the period 2016 - 2019. A high variation across the years was observed at Rome (LIRF) and London Heathrow (EGLL). At Heathrow, 2018 marked the year of introducing time-based separation on final on a 24hr basis. The combination of the high share of observed ATFM delay in 2018 and 2019 and the high demand resulted in an higher number of aircraft on the airport surface. In consequence arriving aircraft experienced longer taxi-in times or holding within the taxiway system. The threshold of two minutes of additional taxi-in time was also observed for European airports. Rome (LIRF) ranged at or above 3 min of additional taxi-in time.
In both regions additional taxi-in times around or below 2 minutes per arrival were observed for the majority of study airports for the period 2016 - 2019. Higher additional taxi-in times were measured at the busiest and most constrained airports. Future research may be oriented towards identifying underlying causes driving the observed taxi-in performance.
6.2 Additional Taxi-Out Time
In analogy to the previous section, the additional taxi-out time addresses the travel time of a departing aircraft blocking-off at its stand/gate position (i.e. actual off-block time [AOBT]) until the aircraft takes off (i.e. actual take-off time [ATOT]). This travel time is compared to an associated reference time.
As mentioned above, the taxi-times at Brazilian airports are determined on the airport level. The inclusion of stand/gate positions is foreseen for future iterations.

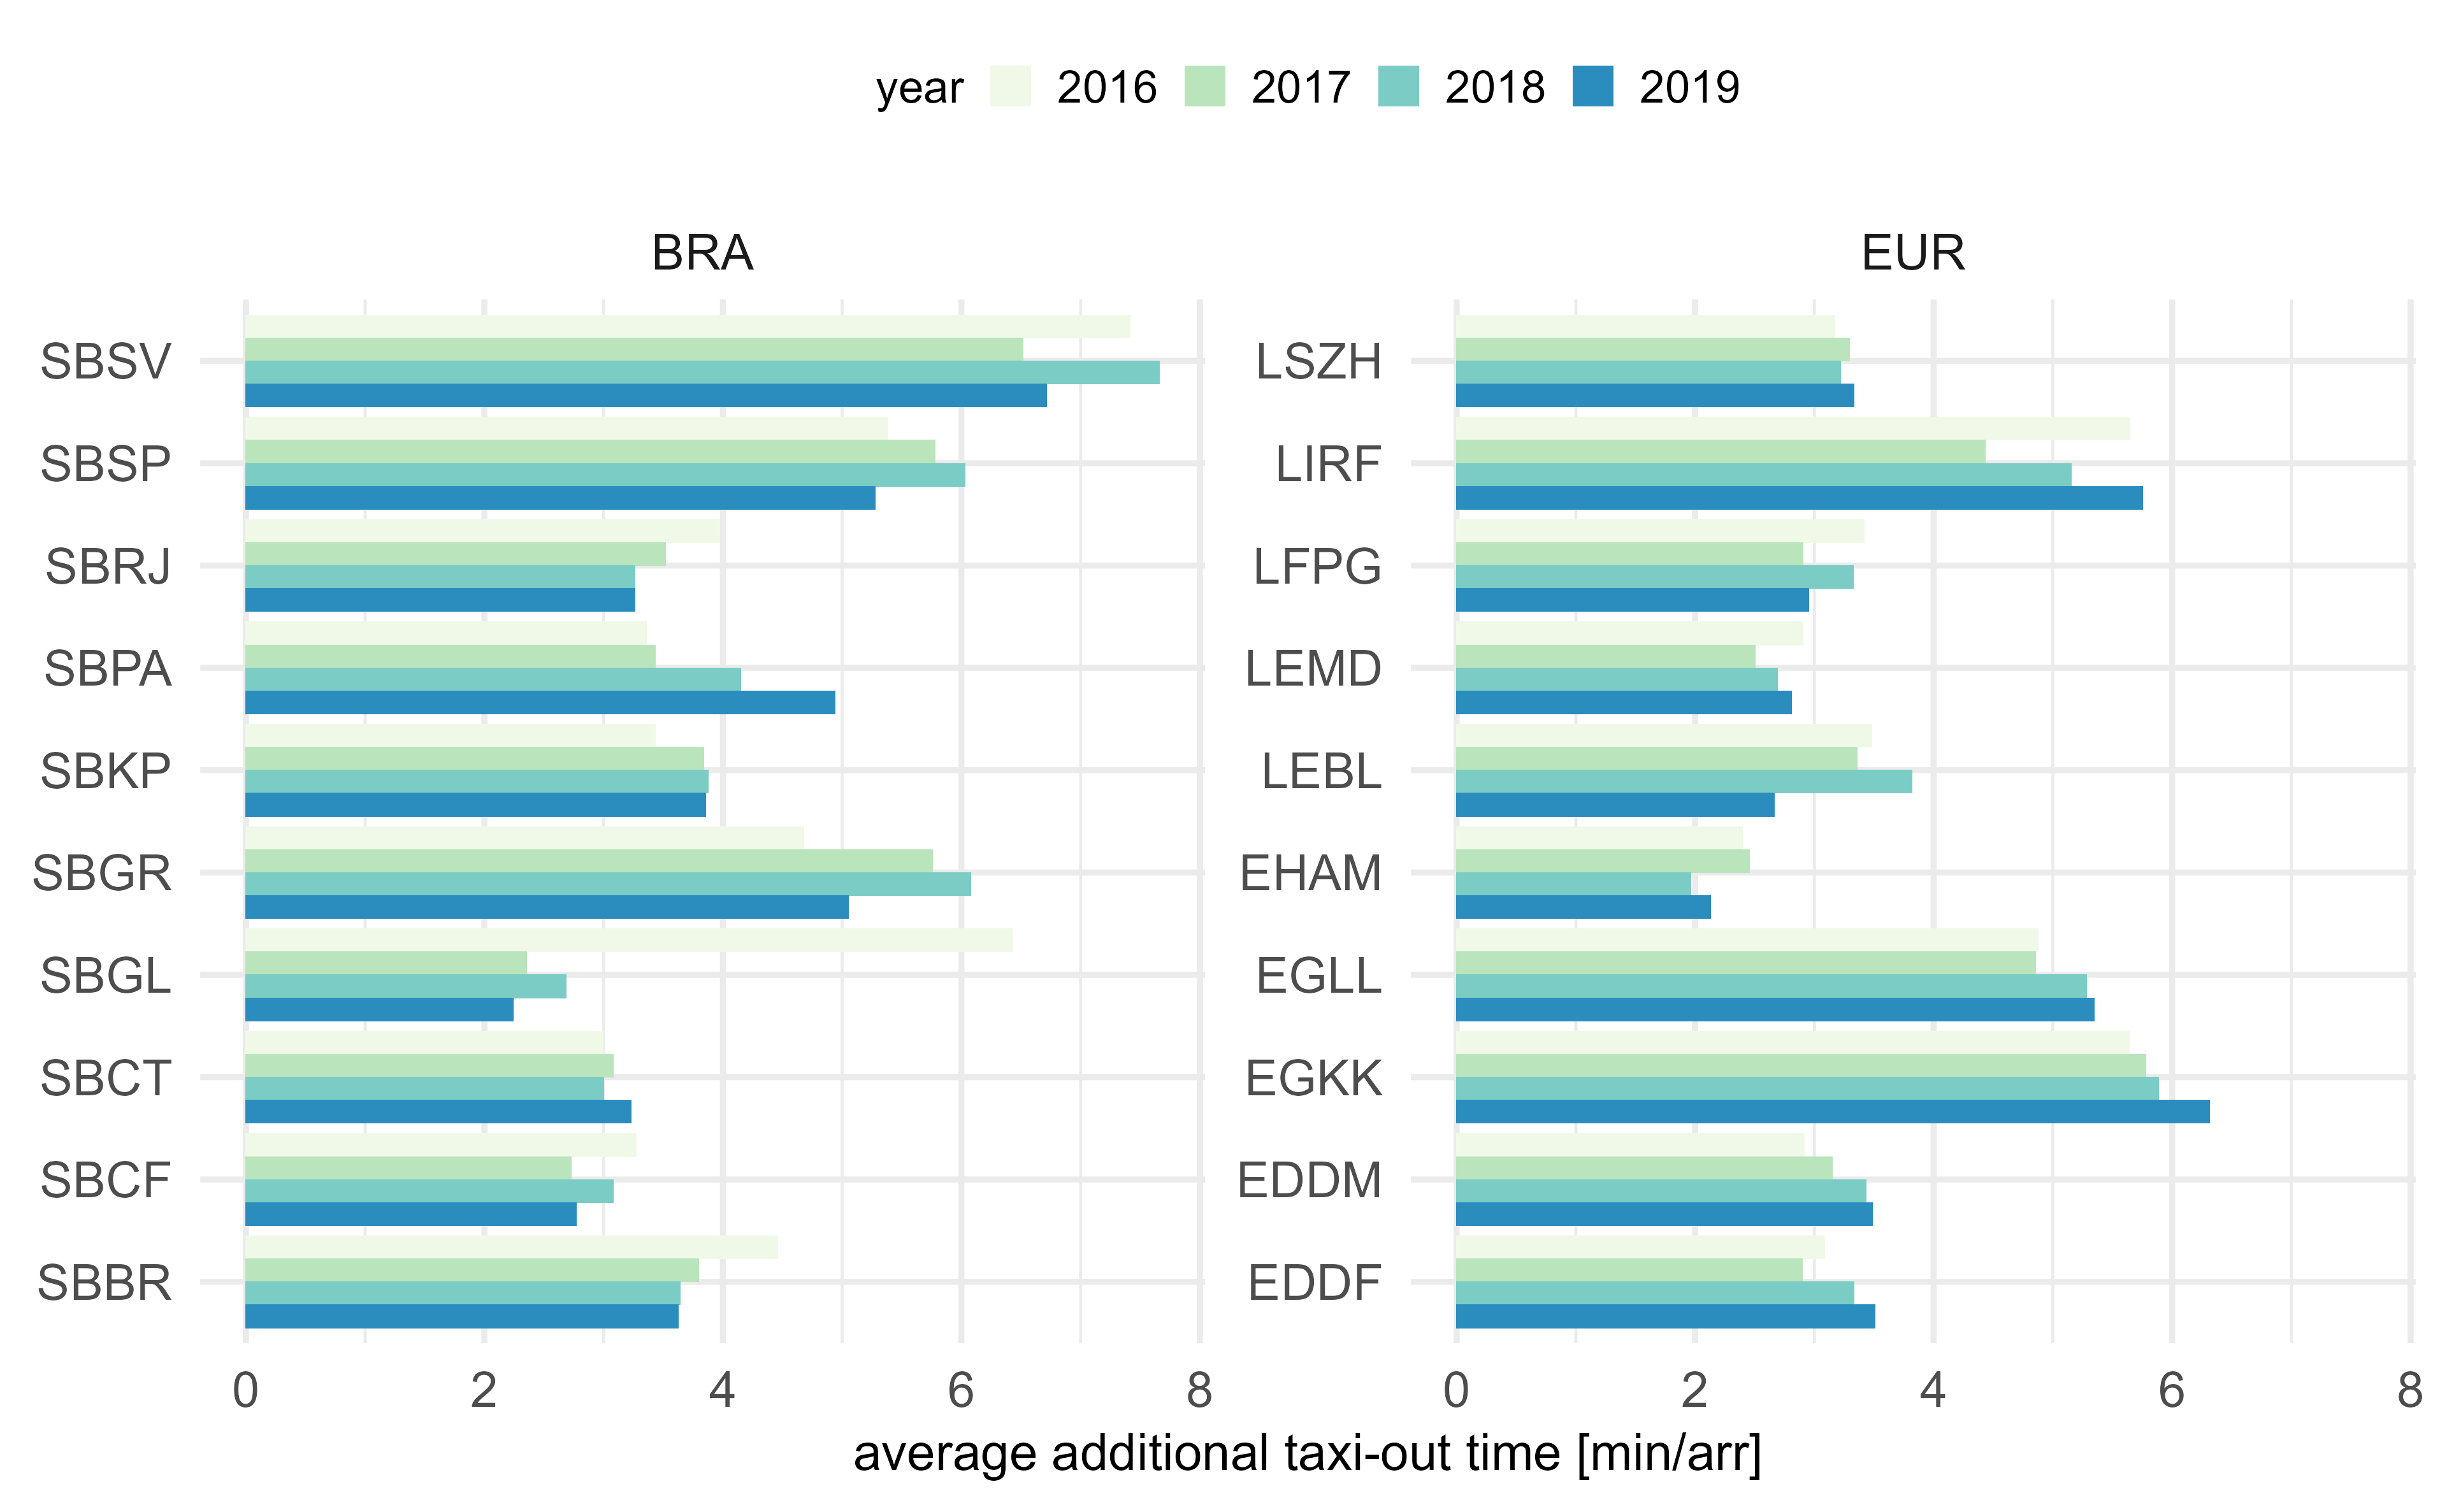
Figure 6.2: Additional taxi-out time
On average, the additional taxi-out time varied across the airports in Brazil. Salvador (SBSV) observed an additional taxi-out time ranging between 7 and 8 minutes in 2018 and 2019. Taxi-out performance at Curitiba (SBCT) ranged even under 2 minutes per departure. The average additional taxi-out performance did deteriorate at Porto Alebre (SBPA) between 2016 and 2019. Conversely, a higher level of performance was observed at Brasília (SBBR).
Brasília (SBBR) observed an improvement of the taxi-out performance after privatisation of the airport operations. Following the process, a variety of infrastructure and operational improvement programmes had been implemented. This resulted in an enhanced gate use layout, pushback operations and streamlined gate/runway allocation (i.e. reduced taxi distance). Airport development and expansion work started in 2016 at Salvador (SBSV). The impact of the works on the main taxiway is evidenced by the variation of observed additional taxi-out times.
The additional taxi-out time ranged for most of the European airports at or below 4 minutes per departure. Departing traffic at London Gatwick (EGKK) observed the highest average additional taxi-out time well above 6 minutes per departure with Rome (LIRF) and London Heathrow (EGLL) ranging between 5 and 6 minutes per outbound flight. These airports also observed an increasing trend for the additional times measured over the period 2016 - 2019.
6.3 Additional Time in Terminal Airspace
For this comparison report, an initial look at the efficiency of arrival airspace operations was performed. Due to data constraints, this use-case analysis addresses the additional time spent in the airspace within 100NM of the study airports in the year 2018.
Conceptually, the additional time in the terminal airspace measures the difference between the excess time of a flight approaching the airport from a specific direction and a corresponding reference time based on similar trajectories. To establish similarity, flights are grouped by entry sector/direction, landing runway, and aircraft type. The entry sector/direction and landing runway determines the procedural aspects of the arrival. The aircraft type allows for the differentiation of varying travel and arrival speeds of the aircraft mix observed at the airports.
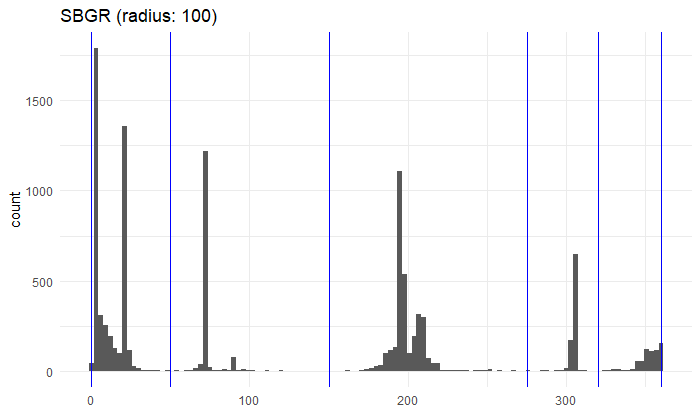
With a view to establish related reference times, groupings of similar arrival flight profiles were identified. This identification was based on a visual procedure to identify arrival sectors. Figure 6.3 shows an example for an airport in Brazil, i.e. SBGR. In this particular example, marked groups of arrivals from about 320 to 50 degrees are grouped into one arrival sector. With the continued technical cooperation between the performance groups in DECEA and EUROCONTROL, the methodology and supporting data processing will be broadened in future reports.

Figure 6.3: Count of arrivals from different approach direction (bearing)

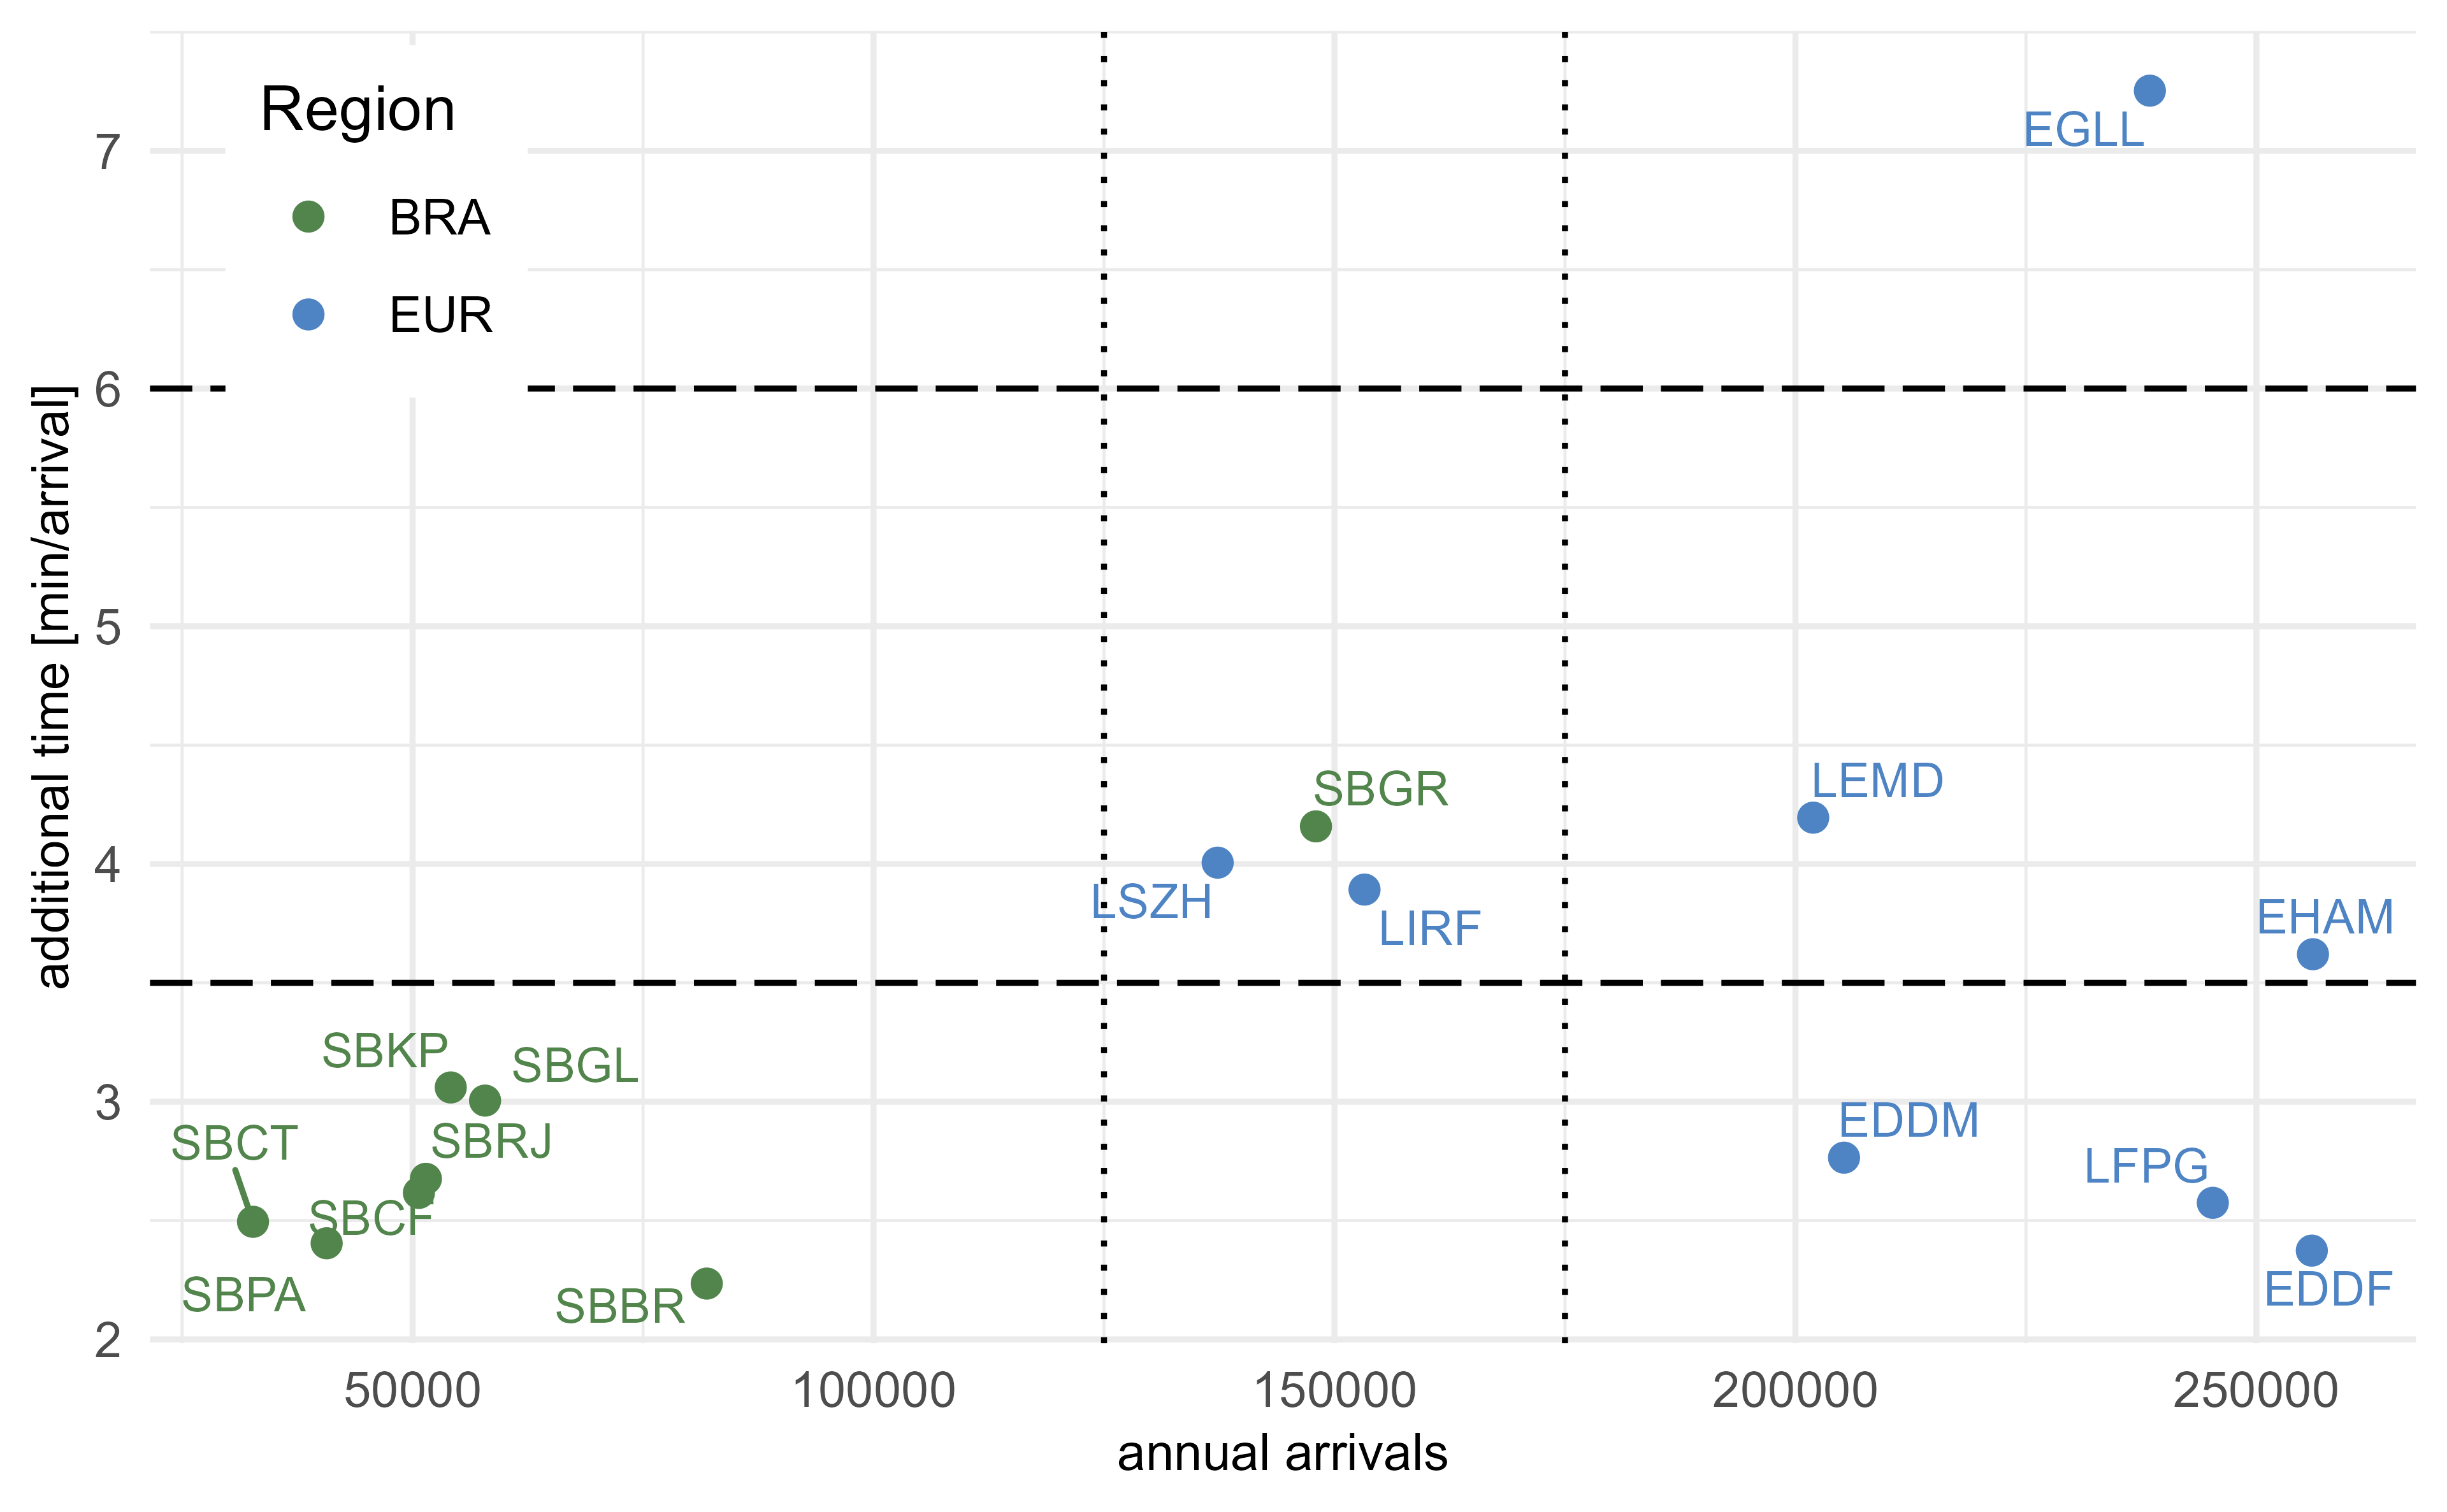
Figure 6.4: Mapping of additional time in arrival airspace to arrival traffic
Fig. 6.4 shows several clusters of observed additional times in the terminal airspace. The lower level of air traffic in the Brazilian region results also in less constrained procedures. The majority of Brazilian study airports accrue for relative small additional times well below a threshold of 3.5 minutes per arrival. A similar low level of additional time was observed for EDDM, LFPG, and EDDF in 2018. As shown above, SBGR showed traffic levels similar to LSZH and LIRF. For this airport triplet, an additional time of about 4 minutes per arrival was observed in 2018. This signals a similar level of traffic demand and associated arrival separation and synchronisation techniques. Within the European context, EGLL exhibited a relatively high additional time in terminal airspace of above 7 minutes per arrival. This was due to the operational concept applied at EGLL entailing aircraft to be loaded into stacks to ensure continuous pressure on the arrival runway.