Chapter 3 Traffic Characterisation
The overarching objective of air traffic services is the provision of safe, orderly, and efficient flow of air traffic. Accordingly, operational system performance is linked to the actual and serviced demand (i.e. air traffic). For operational comparisons, it is therefore important to have a good understanding of the level and composition of the air traffic. The previous section offered - inter alia - a brief summary of the economic context and traffic demand development in both regions. This chapter establishes some key air traffic characteristics for Brazil and Europe to frame the observed operational performance in latter parts of the report.
3.1 Annual Traffic
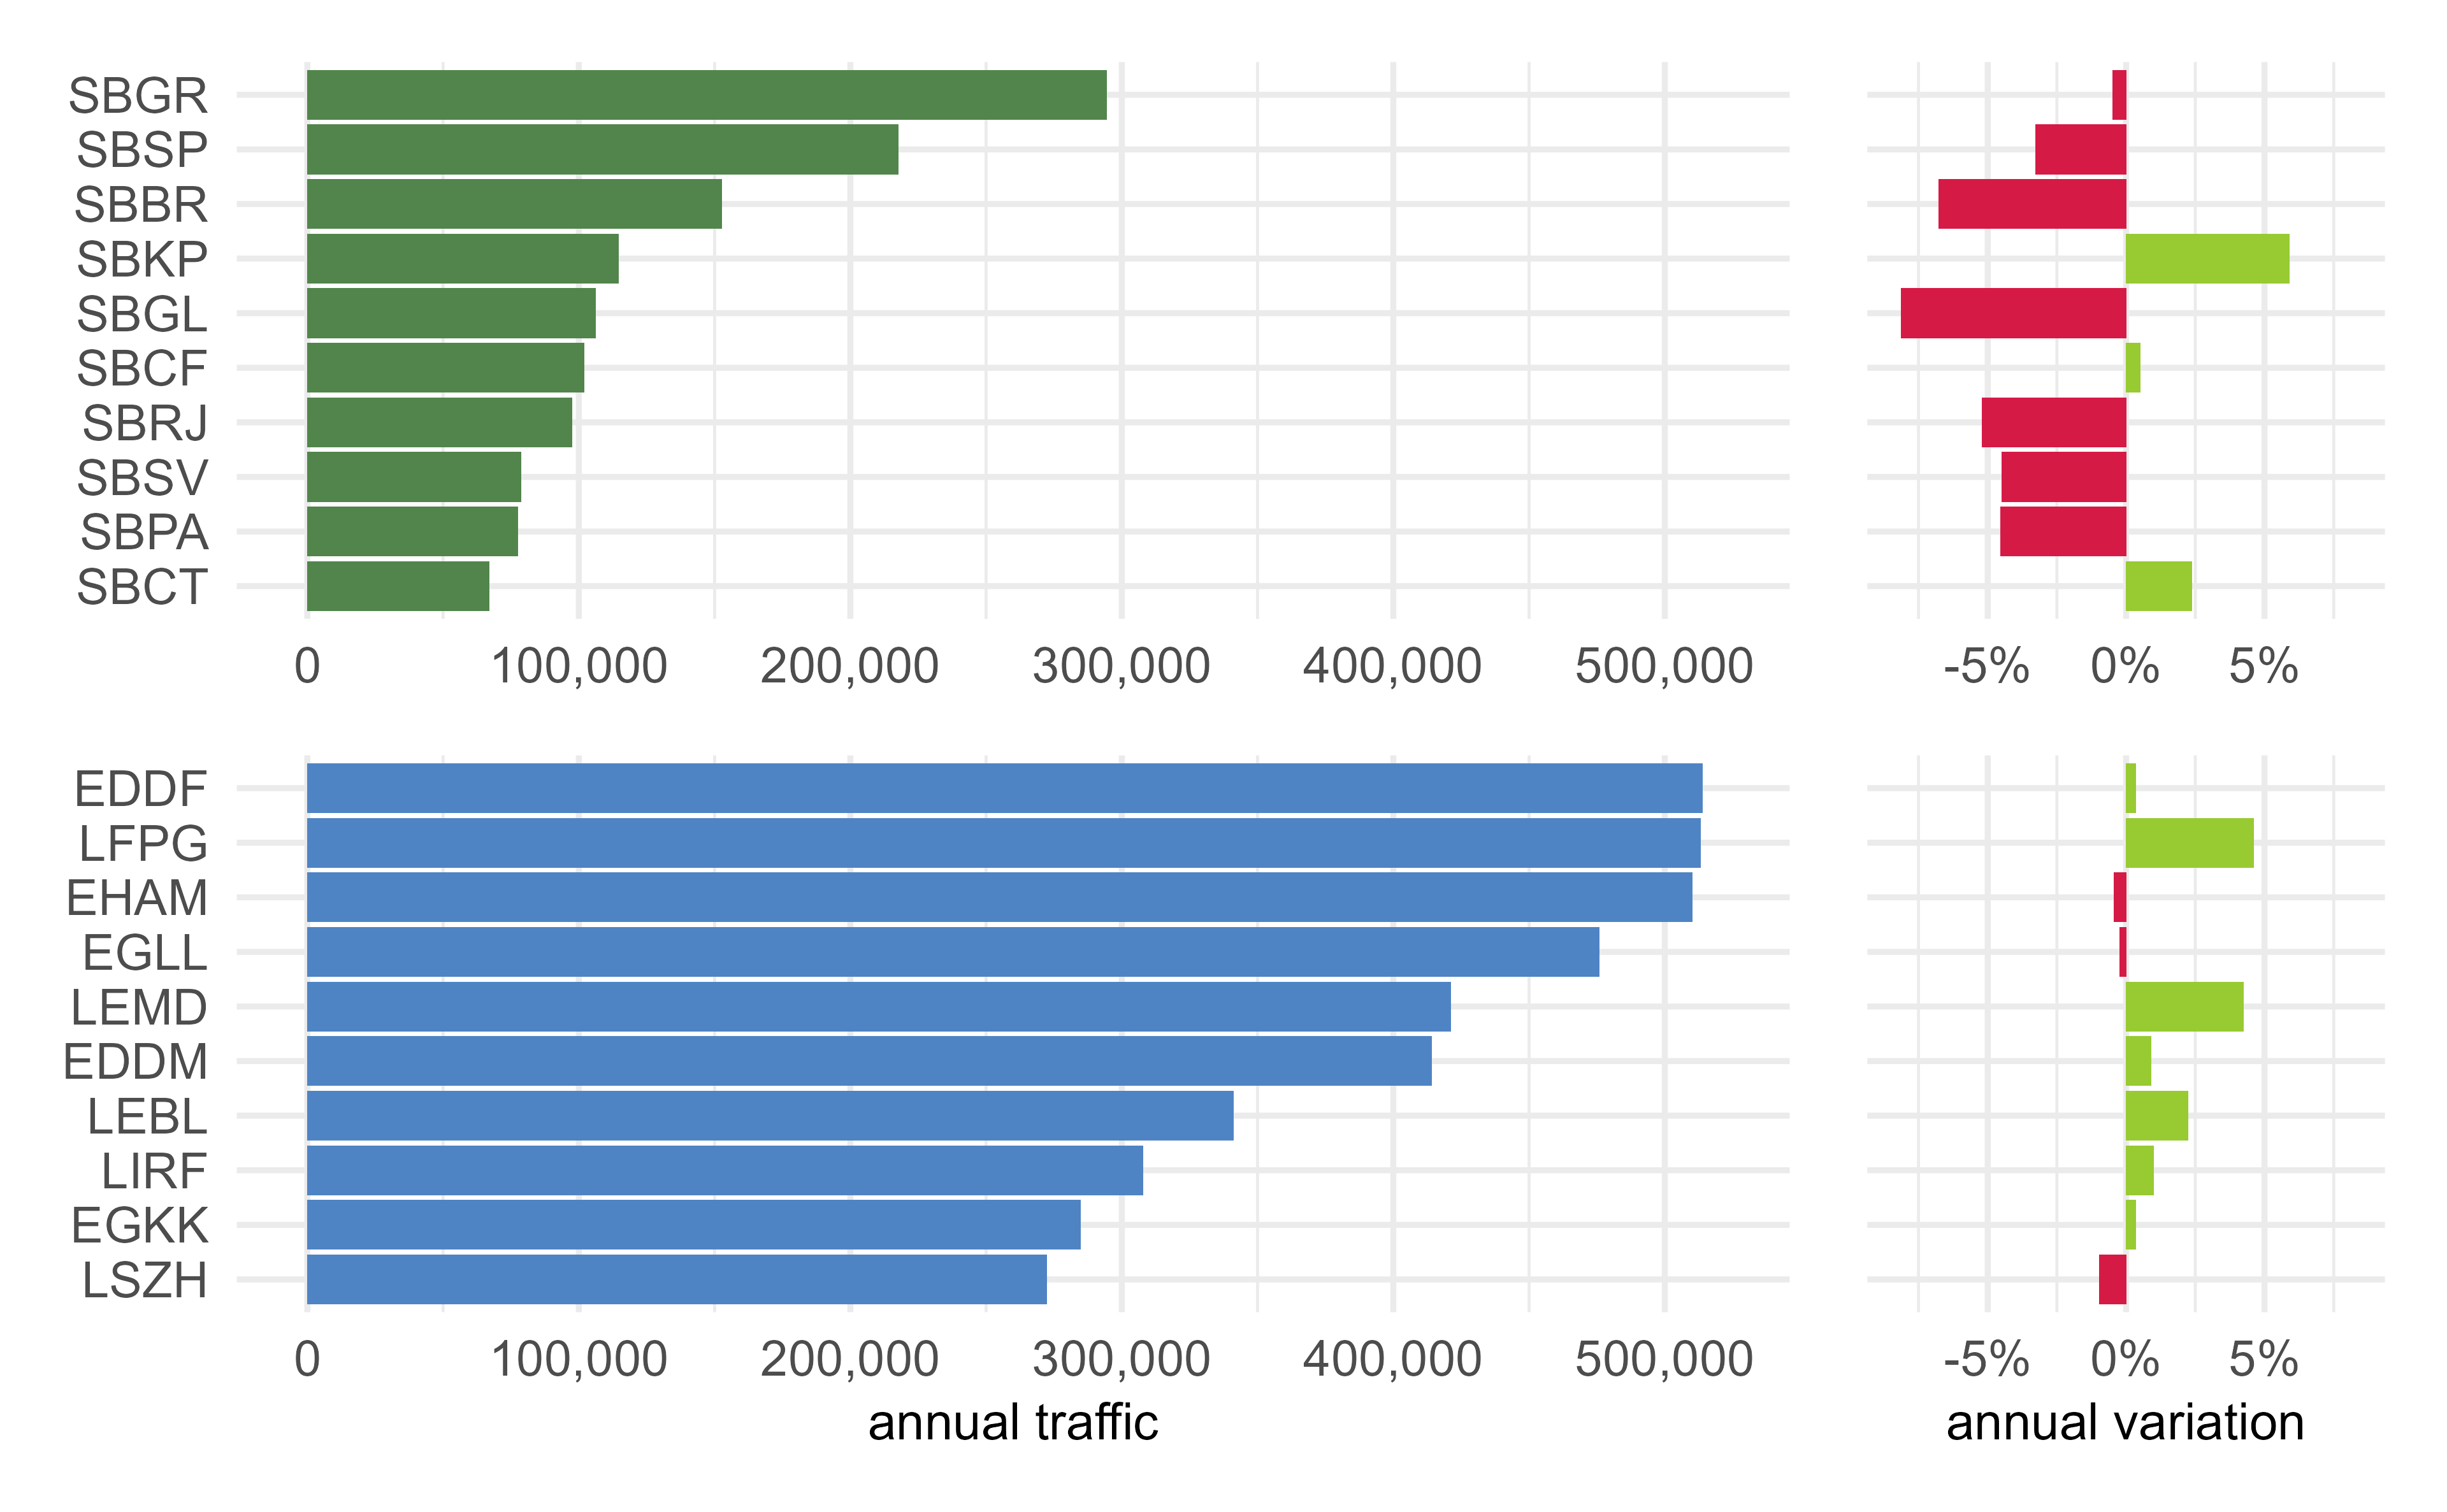
Figure 3.1: Annual traffic at study airport in 2019 and variation 2018/2019
Fig 3.1 shows the annual traffic observed at the study airports in 2019 and the associated annual variation of traffic comparing 2018 and 2019. Given the nature of the chosen airports, changes in the number of movements and its variation provide an indication about the traffic development in both regions.
A discernible decrease of traffic was observed at 6 of the Brazilian airports. This decrease affected also the overall traffic development in the Brazilian airspace. Campinas (SBKP) observed an increase in movements of 5.4%. The busiest airport in the country is Guarulhos (SBGR), with 294469 movements. This number was -0.5% lower when compared to 2018.
The traffic volume at the European airports remained or increased across the European airports in 2019. A negligible decrease of traffic was observed at Zurich (LSZH, ~1%). Traffic variations at London Heathrow (EGLL) and Amsterdam (EHAM) are negligible. Paris Charles de Gaulle (LFPG) and Madrid (LEMD) observed a growth of movements of 4.6% and 4.2% in 2019 compared to 2018. Frankfurt (EDDF), LFPG, and EHAM represented the airports with the highest number of movements, each accounted for about or just under half a million flights per year. EHAM is subject to a political capacity cap placed at 1/2 million commercial movements per annum. Despite its infrastructure of six runways, this cap limits the capacity and respective movement numbers at EHAM. EGLL represented the busiest dual runway (independent parallel) airport in Europe operating at full capacity during most of its opening hours.
As mentioned above (c.f. section High-Level system comparison), the economic context is a driver for air traffic demand. The overall regional growth development was mirrored by the air traffic demand at the chosen study airports. It follows from this initial comparison that traffic levels in Brazil are lower than in Europe for the most relevant ten airports. The busiest Brazilian airport Guarulhos (SBGR) observed traffic levels comparable to London Gatwick (EGKK) and Zurich (LSZH).
3.2 Peak Day Traffic
While the annual traffic provides insights in the total air traffic volume and associated demand, it does not provide insights on the upper bound of achievable daily movement numbers. The latter depends on demand, operational procedures and constraints, and the use of the runway system infrastructure. The peak day traffic is determined as the 99th percentile of the total number of daily movements (arrivals and departures). The measure represents such an upper bound for comparison purposes.
Figure 3.2 shows the peak day traffic in 2019 with reference to the number of runways. Seven out of the 10 European airports have three or more runways and ultimately the infrastructure to achieve the overall number of movements as presented in the previous section. It must be noted that the number of runways is a useful categorical identification. The actual use of the runway system may, however, be impacted by the orientation of the runways, their spacing, and local operational procedures. Following this initial comparison it is planned to develop a more in-depth analysis of the runway system utilisation in each region.
The observed peak day traffic observed at Guarulhos (SBGR), a 2-runway airport, ranged in the same order of magnitude than London Gatwick (EGKK) - single runway - and exceeds Zurich (LSZH) - a 3-runway airport. Sao Paulo (SBSP), the 2nd busiest airport in Brazil, trailed these airports with the other airports showing peak levels in accordance with their annual traffic demand.
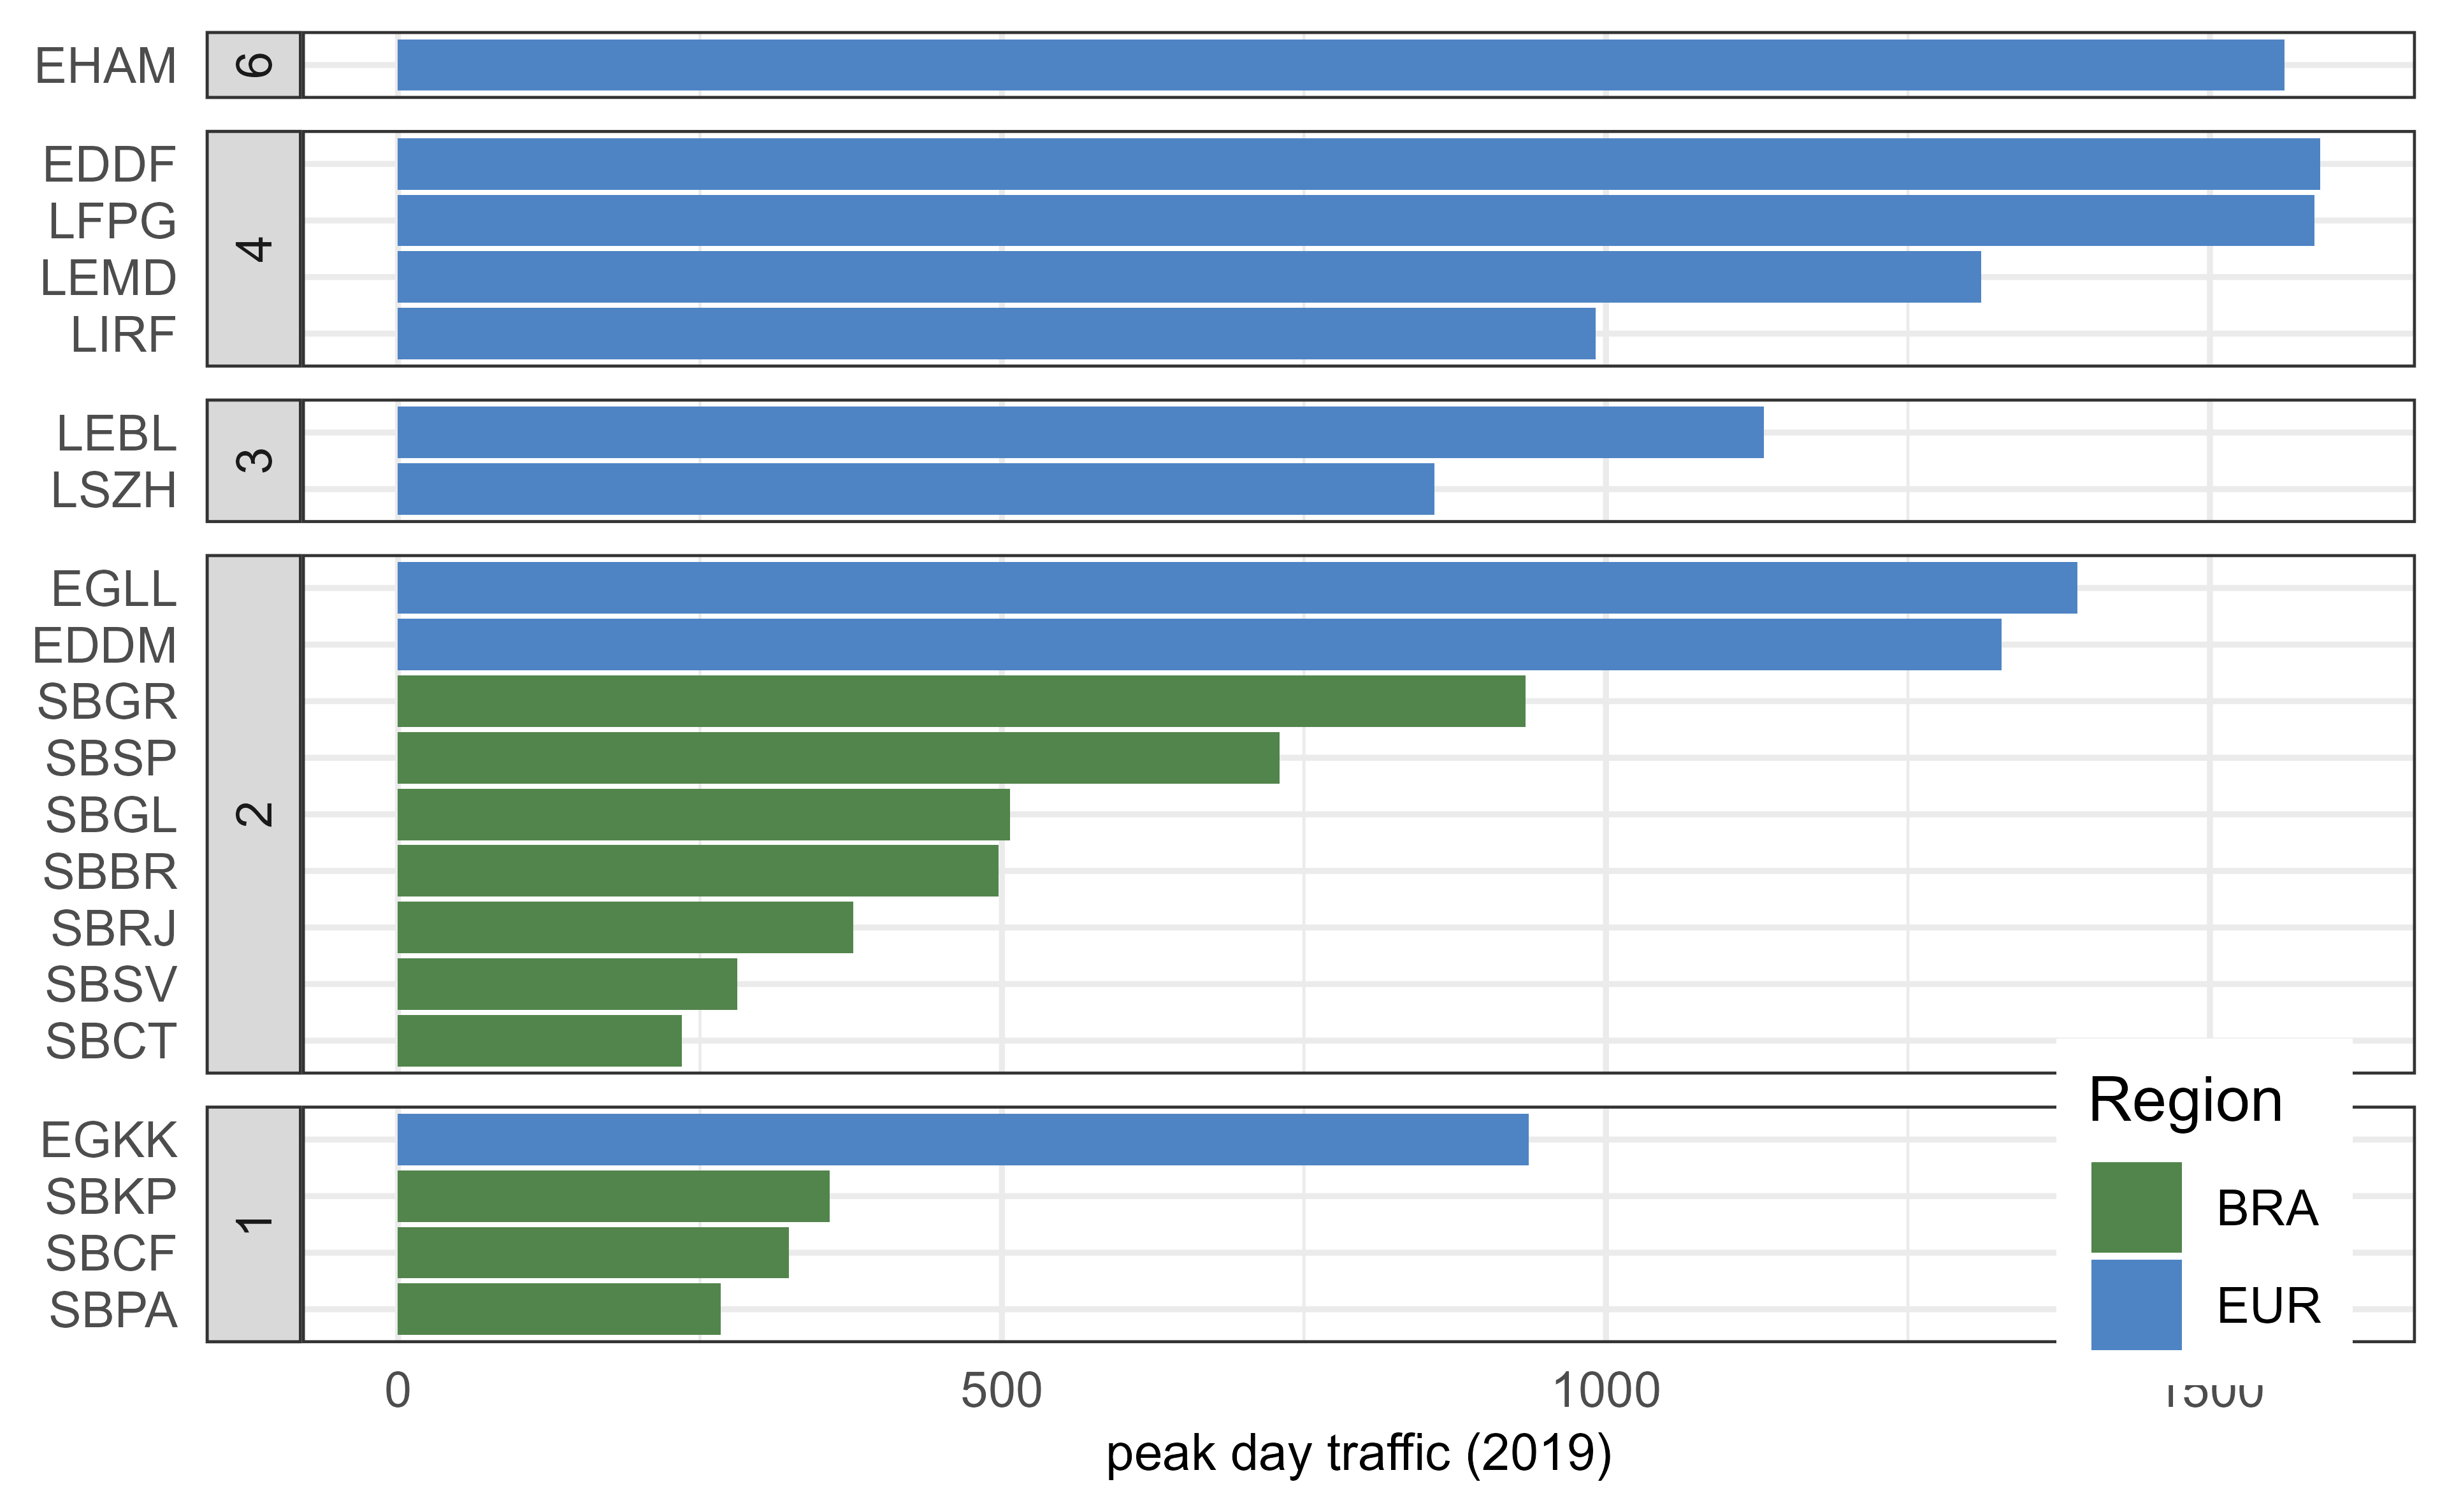
Figure 3.2: Peak day traffic (99th percentile of annual movements)
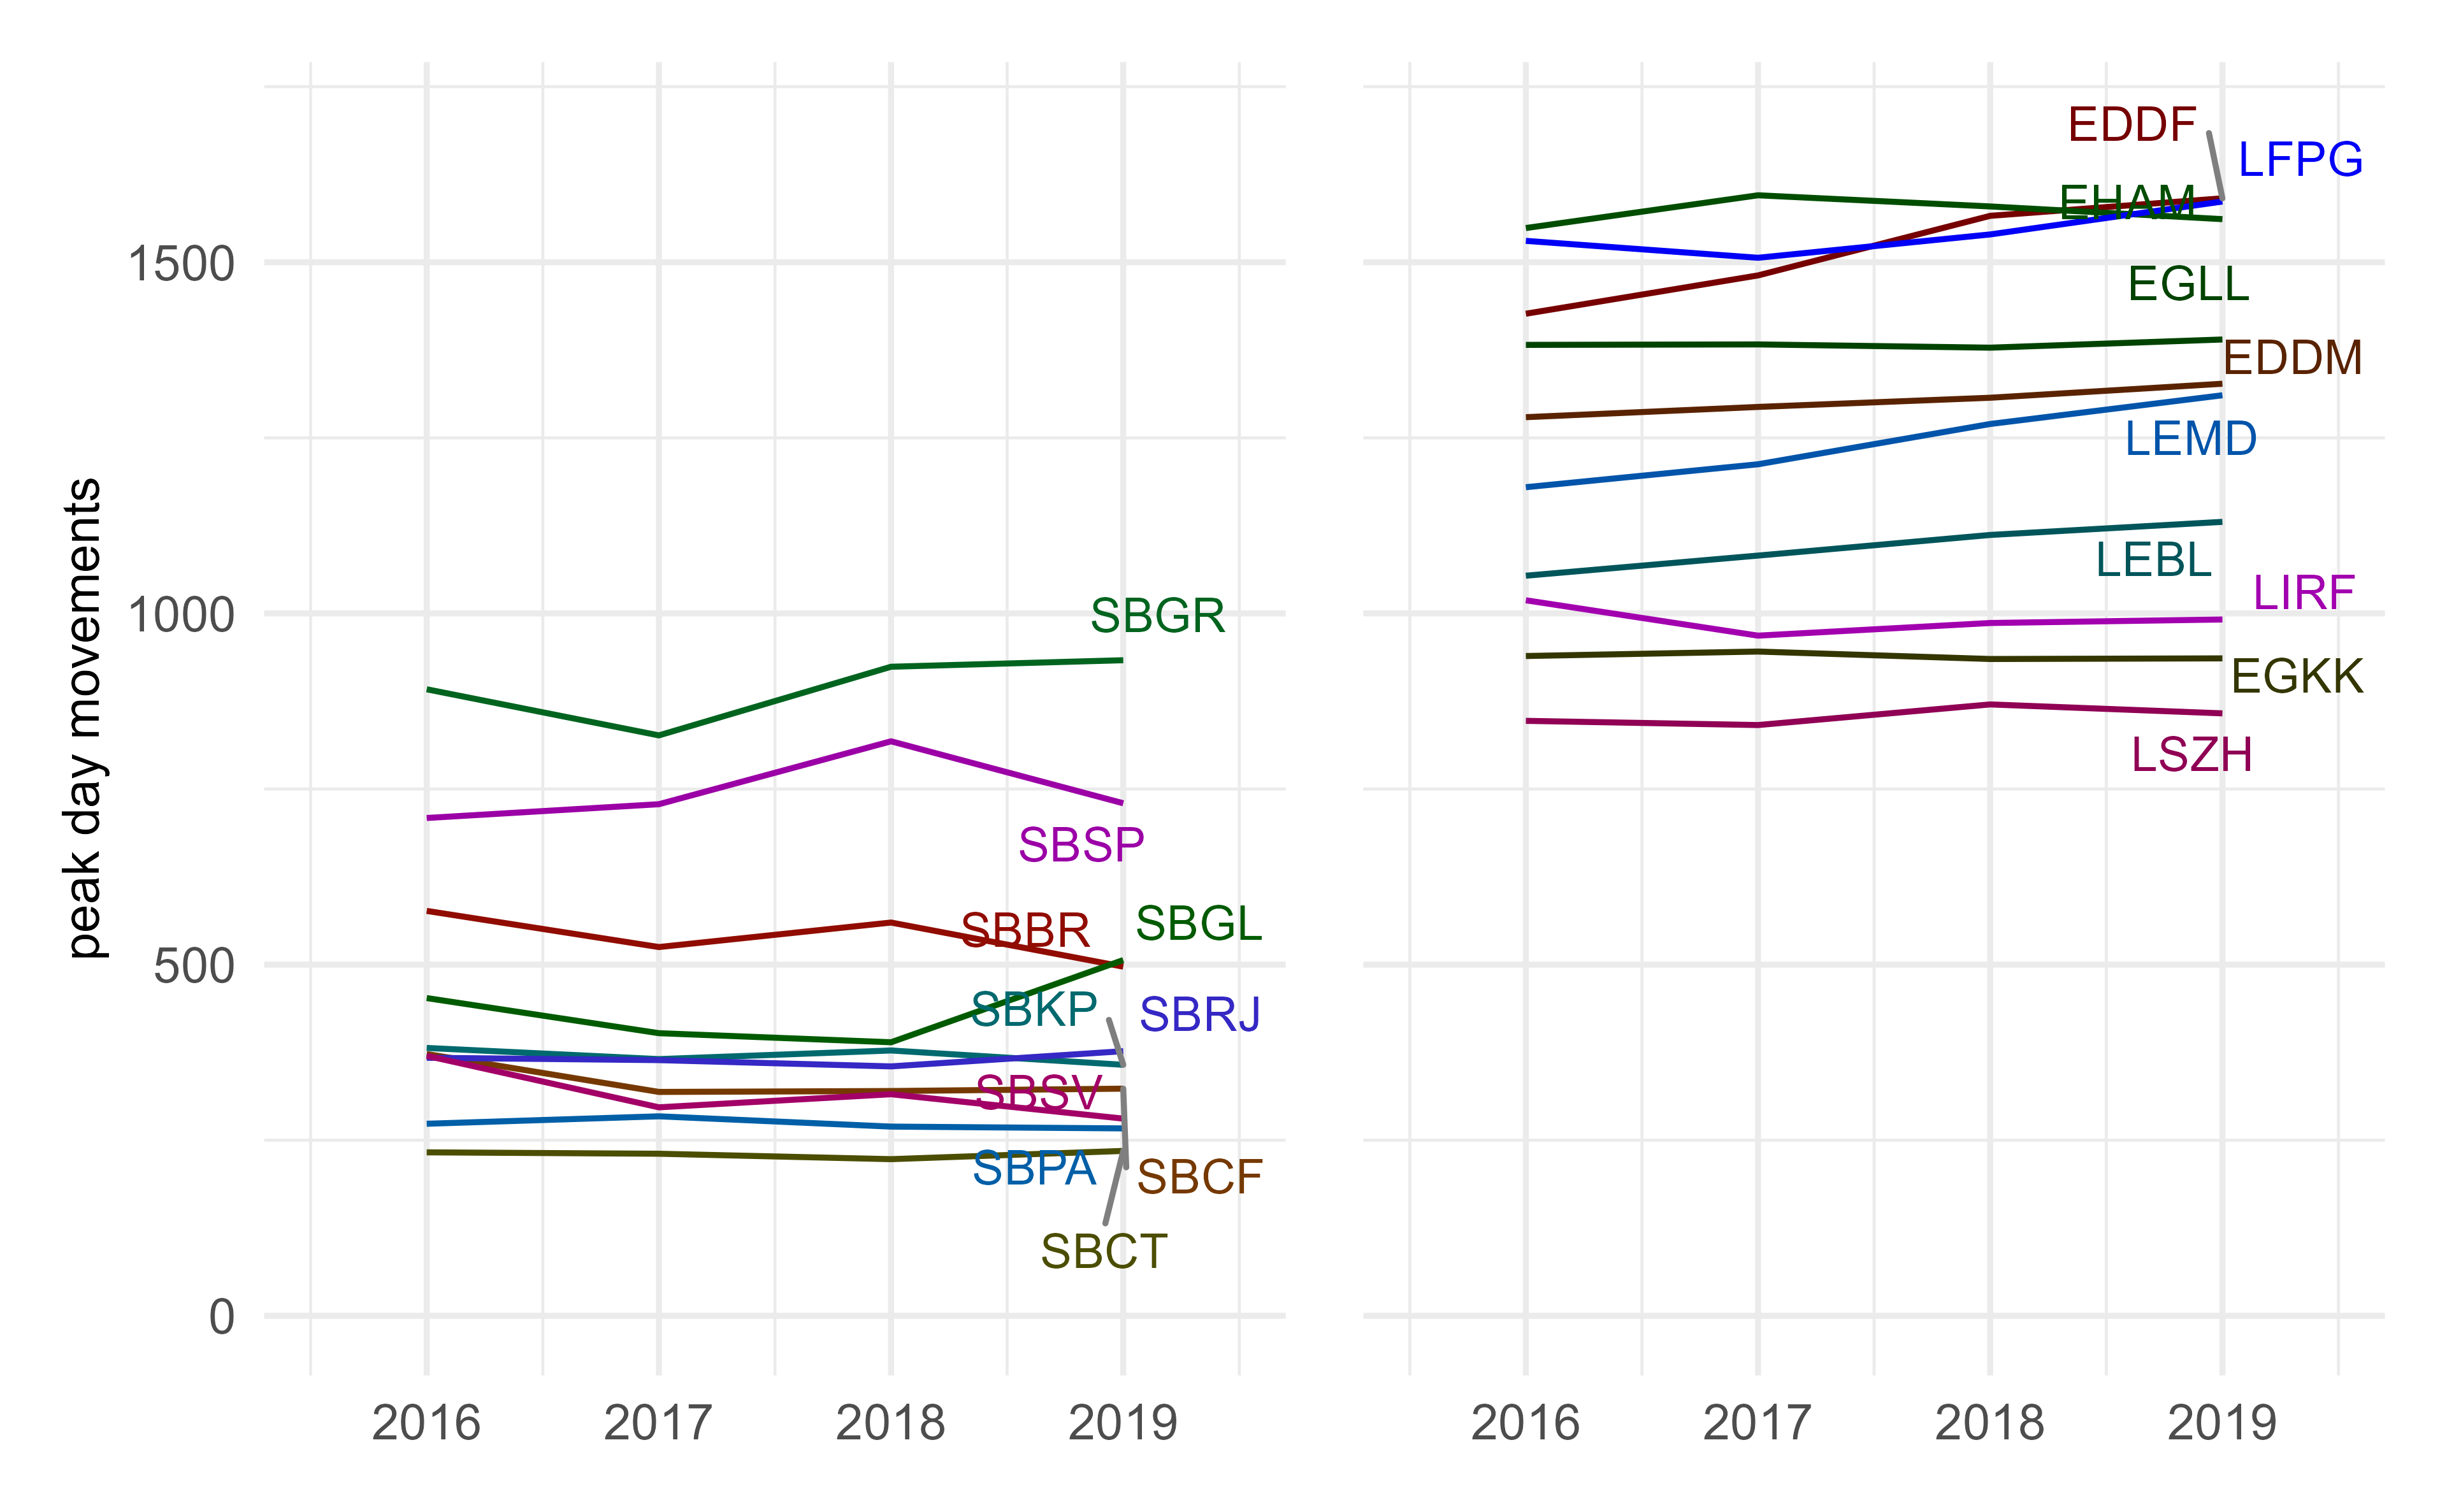
Figure 3.3: Variation of Peak day traffic over time
Figure 3.3 shows the evolution of the peak day traffic. For the majority of airports the peak day movement numbers are stable over the study horizon on average.
In Brazil, peak day traffic at SBBR shows a slight decrease for the period 2016 through 2019. SBSP shows a significant drop when comparing 2018 to 2019. In contrast, peak day traffic increased in Galeão Airport (SBGL) from 2018 to 2019.
SBGL recorded an increase in peak day in 2019 because it received air traffic from Santos Dumont (SBRJ), located in the same city, which closed its main runway due to renovation works for one month. With this, the demand in SBGL increased during that period. Salvador (SBSV) went through renovation works in the main taxiways and this may have influenced demand reduction throughout 2019. One of the main characteristics of SBSV is that it serves as an air traffic hub in the Northeast region of the country. Brasília (SBBR) may have been impacted in the period from 2015 to 2017, mainly because of the economic crisis in Brazil. Brasília is the federal capital and the main political centre of the country and more sensitive to fiscal adjustment in the public sphere.
With the exception of Heathrow (EGLL) and Zurich (LSZH) the peak day traffic increased across Europe. Both, EGLL and LSZH, operated consistently at the maximum levels during peak periods. With the current capacity limit and associated operational procedures, no further increase can be expected. Rome (LIRF) showed a slight decline of the peak day traffic. With a shallow increase in the annual traffic count, traffic was more spread across the days. Madrid (LEMD) experienced a significant increase in peak day traffic over the study period and goes in hand with the annual traffic growth observed. The development is less pronounced in Barcelona (LEBL) showing a general increase of attractiveness of the two Spanish airports and markets. The other airports showed a relatively stable peak day traffic measure. Traffic and inter-connectivity at the European study airports is generally stable as a side effect from the slot declaration mechanism.
On average, traffic levels at the European study airports were higher than in Brazil. Nonetheless, both airports serving São Paulo, i.e. Guarulhos (SBGR) and São Paulo/Congonhas (SBSP), see peak traffic levels comparable to some European airports (e.g. LIRF, EGKK, LZSH). The top 10 airports in Europe in 2019 ranged approximately at or above 800 daily movements, c.f. Fig 3.2.
In addition to the economic differences between Brazil and Europe, highlighted by the severe recession that Brazil has experienced in the last decade, Brazilian airports have some capacity limitations in their infrastructure. Despite the recent investments provided by airport concessions to the private sector, only Brasília (SBBR), among the ten studied airports, had simultaneous operations on two independent runways. The other airports operated with only one runway or, as it is the case with Guarulhos (SBGR), with two runways in a dependent manner.
3.3 Fleet Mix
The fleet mix - and in particular the separation requirements between the different aircraft types - is an important influencing factor for the capacity and observed (and realisable) throughput. In particular, aircraft with longer runway occupancy times or larger proportions of heavy aircraft may result in lower throughout due to the larger wake turbulence separations. The locally defined capacity values may therefore differ based on the predominant fleet mix and operational characteristics, and ultimately result in different observed Peak Day movement numbers. Figure 3.4 depicts the observed share of different wake turbulence categories across the study airports in 2019.
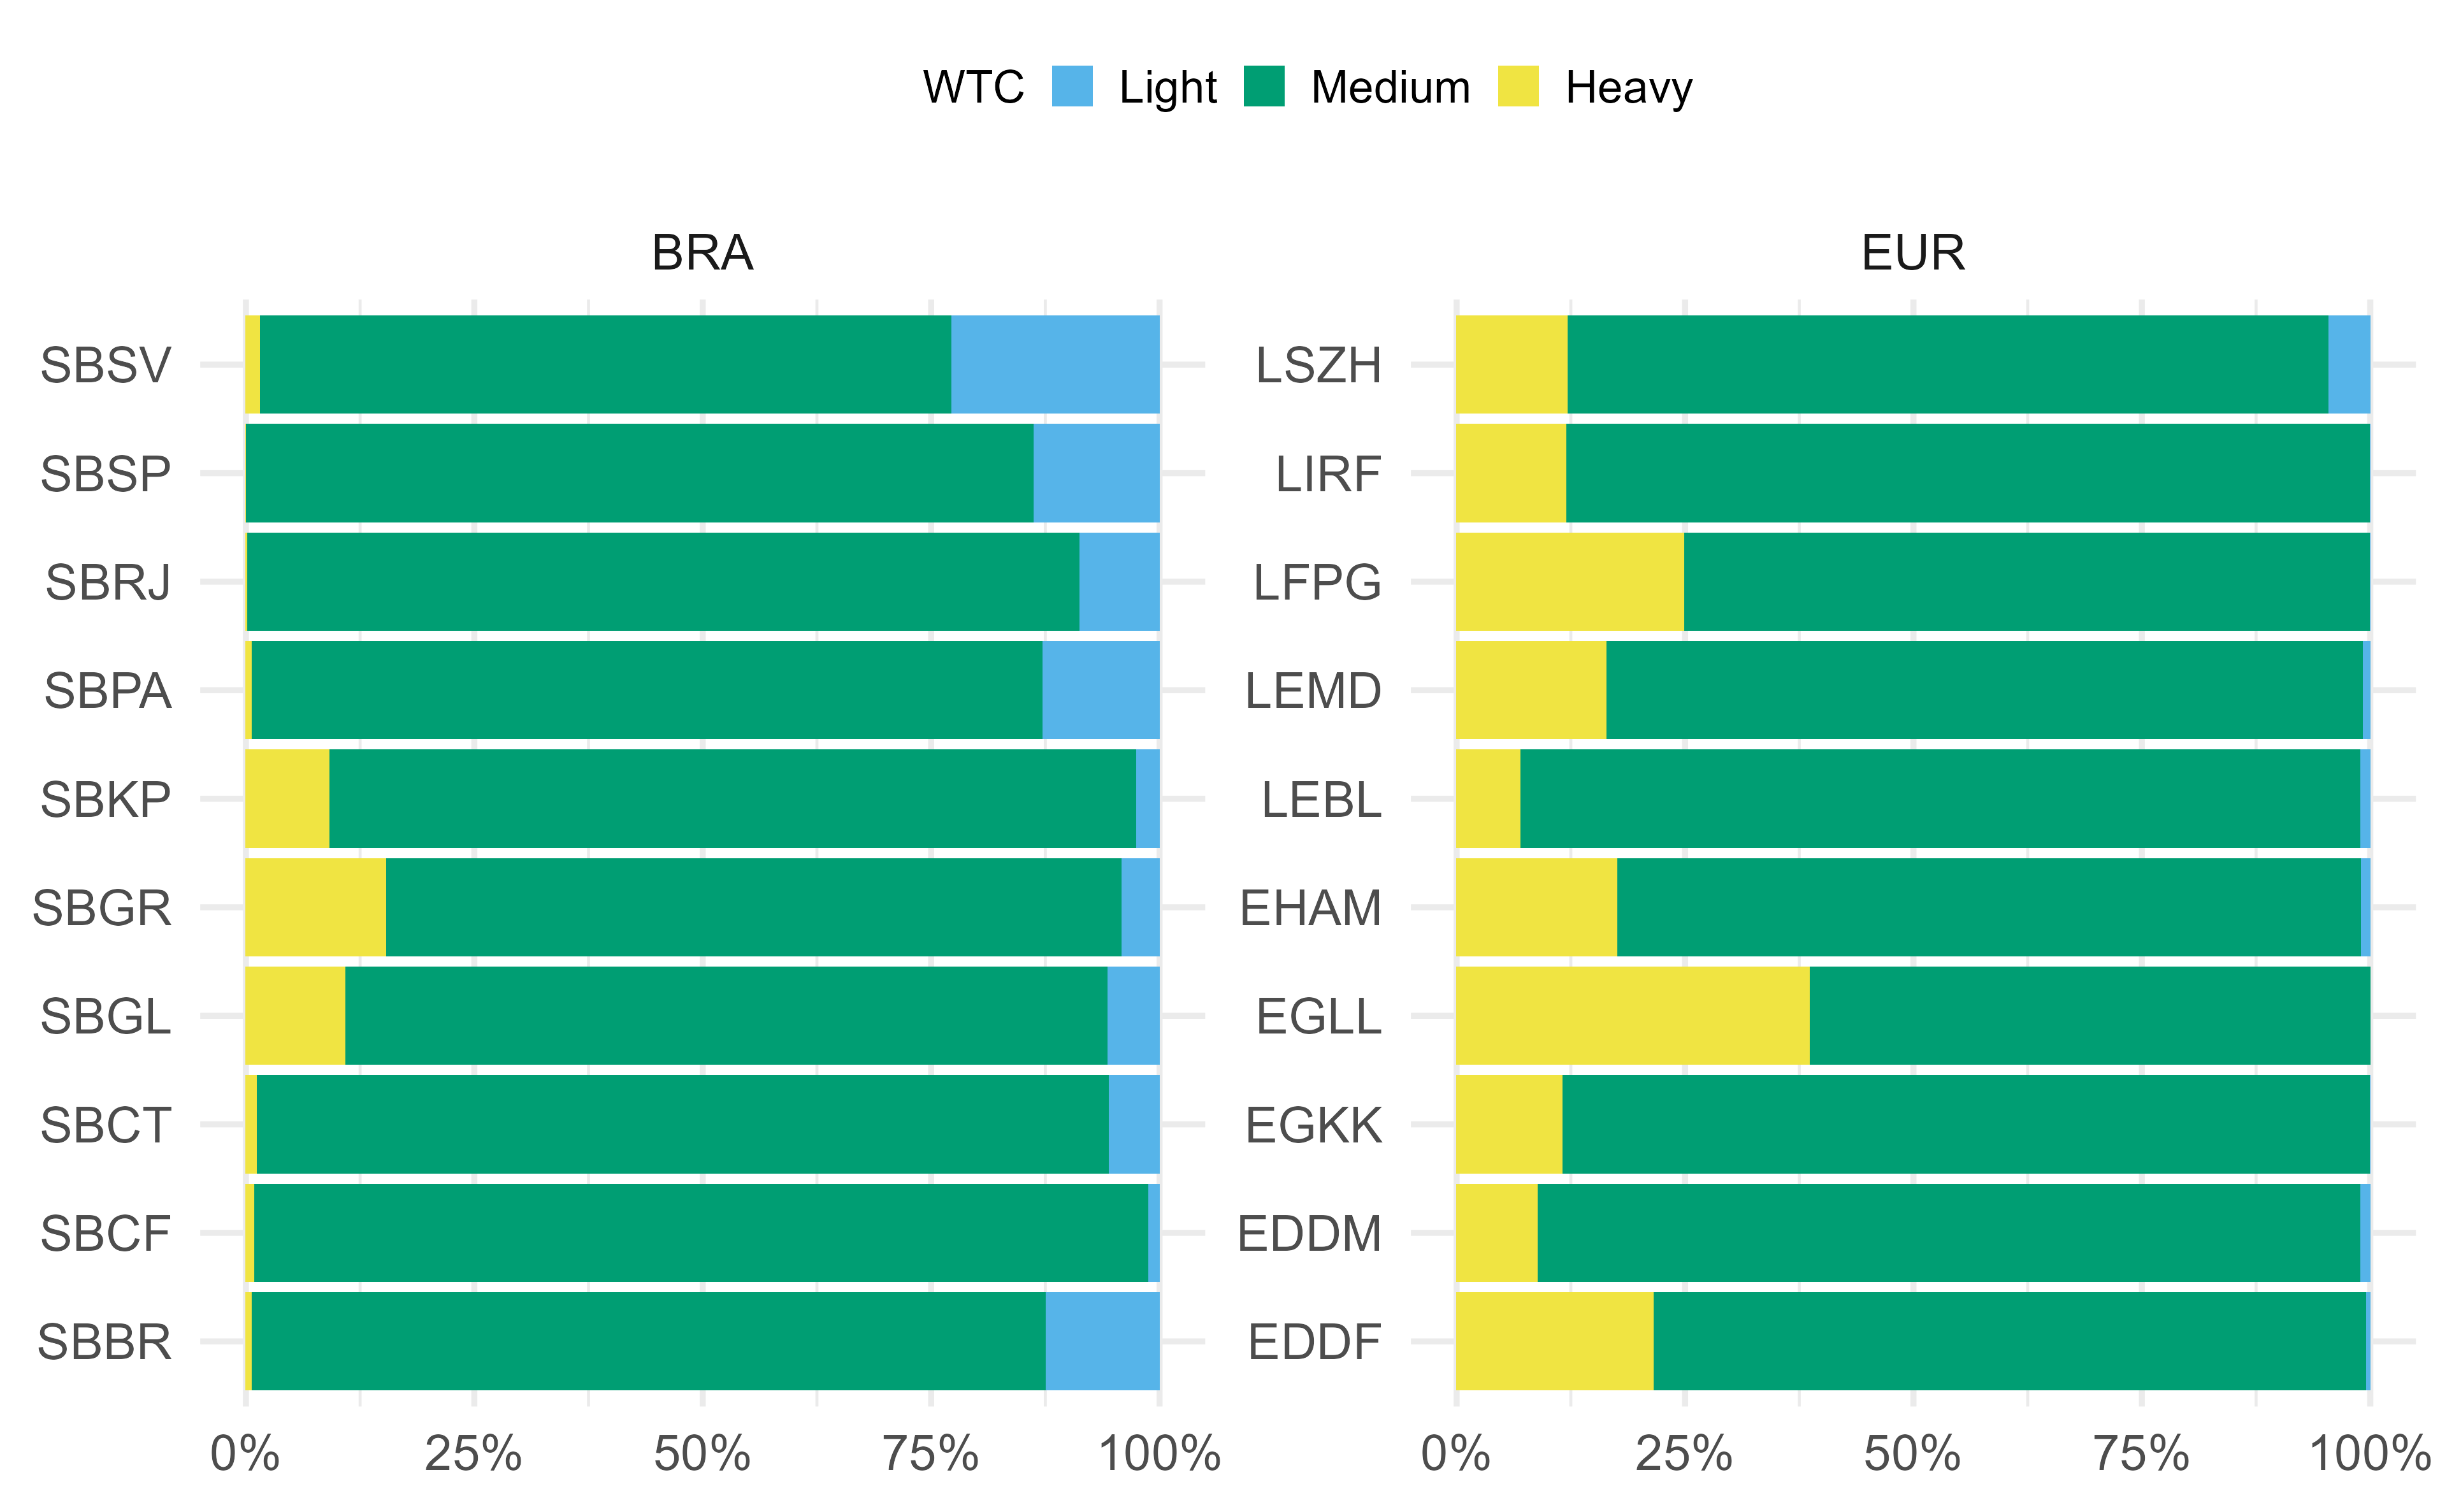
Figure 3.4: Fleet mix observed at study airports in 2019
Across the Brazilian airports, Medium aircraft are the predominant aircraft class with Galeão (SBGL), Guarulhos (SBGR), and Campinas (SBKP) showing a good share of Heavy aircraft ranging around 10-12% of the traffic. Salvador (SBSV) has a relevant share of Light aircraft accounting for approximately 25% of the observed fleet mix
SBGL and SBGR are international hubs for aviation in Brazil. In addition, SBGR and SBKP are among the largest cargo terminals in the country. SBSV stood out for being a large tourist destination in the summer, during Carnival and music events. Congonhas (SBSP) and Santos Dumont (SBRJ) do not operate international flights and have operational restrictions. In view of the short runways at both airports, both airports do not operate heavy aircraft flights. Confins Airport (SBCF) has few light aircraft flights due to the existence of another airport (Pampulha) in the city of Belo Horizonte that absorbs this demand due to its convenient location.
For the European airports a higher level of Heavy aircraft was observed. The structure of the European network is characterised by multiple national hubs across the different Member States. The chosen study airports comprise the major airports in Europe and represent hubs for regional and international travel. The European airports observed a good share of cargo air transport operations for the study period with - for example - KLM operating out of Amsterdam (EHAM), Air France operating out of Paris Charles de Gaulle (LFPG), or Lufthansa out of Frankfurt (EDDF) and Munich (EDDM). Based on this network structure, the share of Light types across the European airports was relatively low. Zurich (LSZH) was a noticeable exception from this rule with a share of Light types of 4.5%.