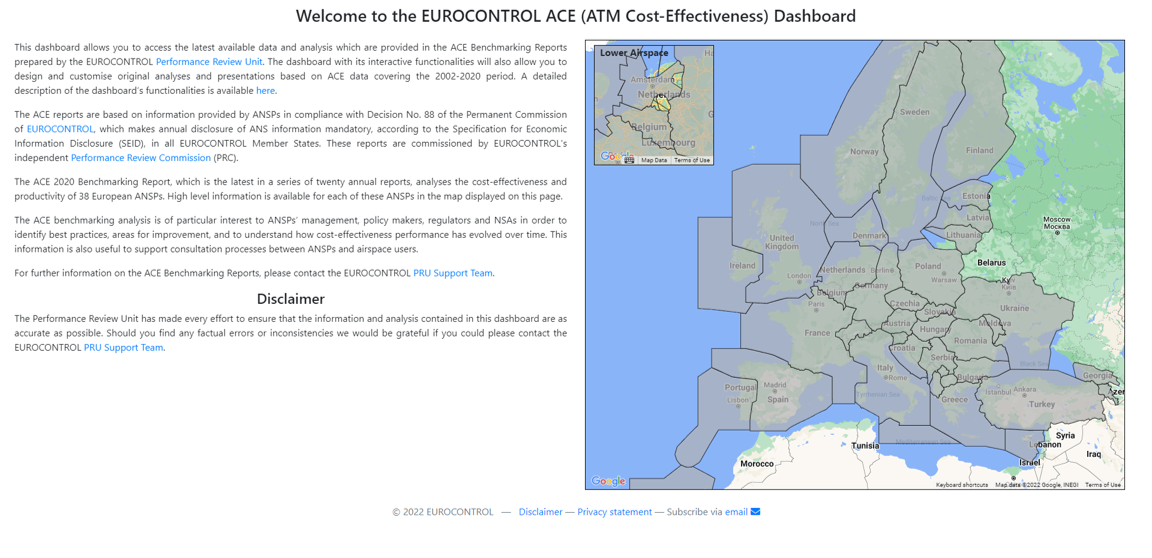
ATM Cost-Effectiveness (ACE) benchmarking
The ACE benchmarking project analyses the cost-effectiveness and productivity of 38 European Air Navigation Service Providers (ANSPs) in Europe. It examines both individual ANSPs and the Pan-European ATM/CNS system as a whole.
In addition to the publication of interim and final annual reports, an interactive dashboard containing the whole ACE data (2002-2021) has been developed. It enables the aviation community to build customised views on ANSPs economic performance.
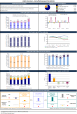
High-level summary report on preliminary ACE 2022 data (December 2023)
This report is based on the 2022 data submitted by ANSPs in July 2023. It should be noted that the data presented in this document are still preliminary and not yet fully validated. The final ACE benchmarking report will provide more detailed information on observed changes for selected performance indicators both at pan-European system level and at ANSP level.
€470
(-34.7% vs 2021)
ATM/CNS provision costs per composite flight-hour
€319
(-35.2% vs 2021)
Support costs per composite flight-hour
€133
(-2.3% vs 2021)
ATCO employment costs per ATCO-hour
0.88
(+46.9% vs 2021)
ATCO-hour productivity
Traffic (measured in composite flight-hours) rose by +58% in 2022 but remained -13% lower than in 2019. At ANSP level, a wide range of recovery rates is observed (from -51% to +14%). The war in Ukraine resulted in airspace closures and bans on air carriers which impacted traffic flows in Europe.
ATFM delays in 2022 almost reached their 2019 level, which was a year marked by significant capacity issues for several ANSPs. As a result, the share of ATFM delays in the 2022 unit economic costs amounted to 20%.
After two years of consecutive decreases, total ATM/CNS provision costs rose by +3% (+€297M) in 2022, reflecting cost increases for 26 out of 38 ANSPs.
In 2022, the number of ATM/CNS staff was slightly lower than in 2021 (-1% or -473 FTEs), mainly because of support staff reductions. The number of ATCOs in OPS increased by +2% (+356 FTEs).
Although the level of debt fell by -10% in 2022, short and long-term borrowings still represent nearly 3 times the amount recorded in 2019.
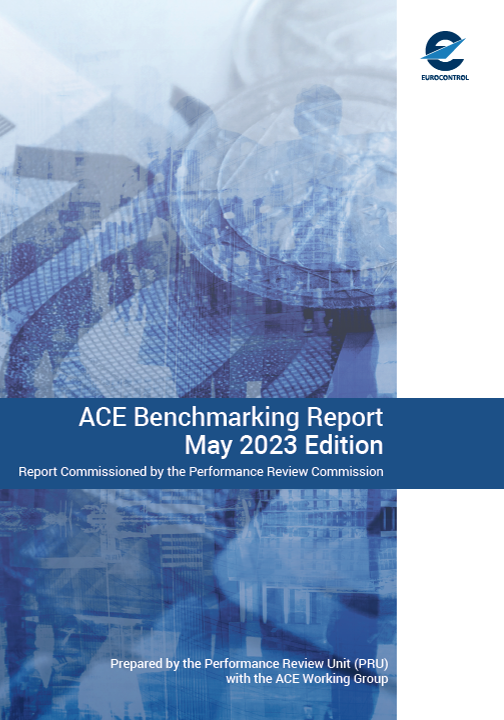
Latest ACE Report (May 2023 edition)
Executive summary
- Introduction
Main Chapters:
- Pan-European cost-effectiveness performance in 2021
- Trend analysis and COVID-19 impacts on cost-effectiveness
- Impact of the COVID-19 pandemic on ANSPs financial situation
- Overview of ANSP capex and impacts of the COVID-19 pandemic on investment
- Forward-looking cost-effectiveness (2022-2024)
Annexes
- ANNEX 1 – Status of ANSPs 2021 Annual Reports
- ANNEX 2 – Performance indicators used for the comparison of ANSPs
- ANNEX 3 – Performance ratios
- ANNEX 4 – Exchange rates, inflation rates and purchasing power parities (PPPS) data
- ANNEX 5 – Key data
- ANNEX 6 – Performance indicators at FAB level
- Glossary
ACE Handbook
Learn about the scope of the ACE analysis, the processes involved in the production of the report, the factors affecting performance and the indicators used in the ACE analysis.
ANSPs factsheets and individual summary reports
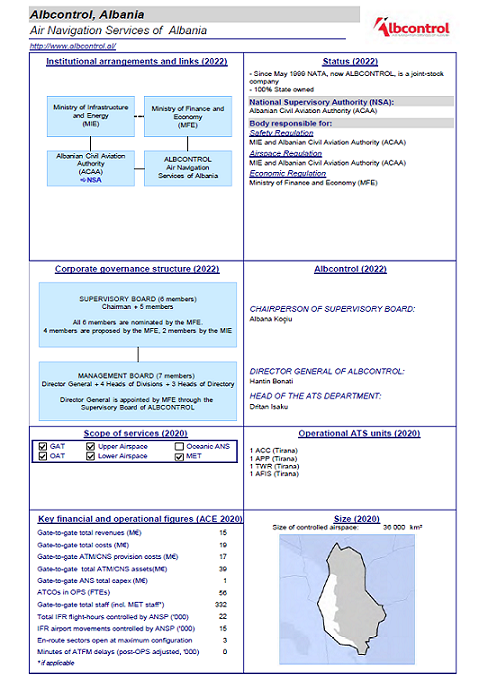
Access information on individual ANSPs institution arrangements, legal status, corporate governance structure, scope of services, etc.
Access information on individual ANSPs cost-effectiveness performance (2016-2021), comparison with peers and historical information on capital investments projects.
For feedback or questions please contact the PRU Support Team.